Hi all,
I have a very simple report with one table which is not behaving as I expect and I do not understand why…
See PBIX here using dummy data to demonstrate:
Adding measure creates rows which do not exist.pbix (23.0 KB)
My data model consists of two tables, related on [Car ID]
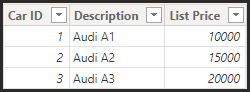
1, List Prices - 3 records for 3 different Audi’s and their List Prices
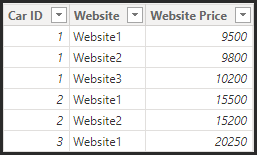
2, Website Prices - Prices from websites where the price has been checked to see if it is higher or lower than List Price.
The Audi A1 has been checked on 3 websites, the A2 on 2 websites and the A3 on one website:
The goal of the table is simply to output the data from the two tables, so the user can check to see how the prices being offered by the different websites compare to List Price.
I have created 3 measures:
Avg List Price
Avg List Price =
AVERAGE('List Prices'[List Price])
Avg Website Price
Avg Website Price =
AVERAGE('Website Prices'[Website Price])
Price Position - A percentage to show if the car is less or more than List Price
Price Position =
DIVIDE([Avg Website Price], [Avg List Price], 0)
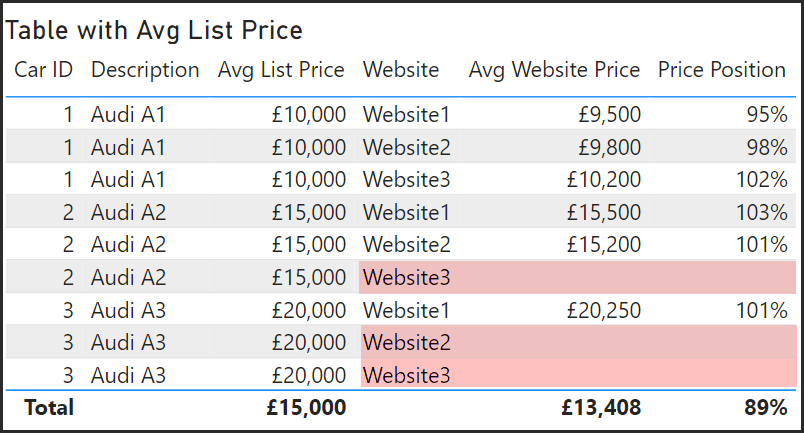
When I output the results into the table, all is fine until I add [Avg List Price]. When I do this, the table displays 9 records, like it has done a cartesian join, so I end up with rows which I do not want as they do not exist:
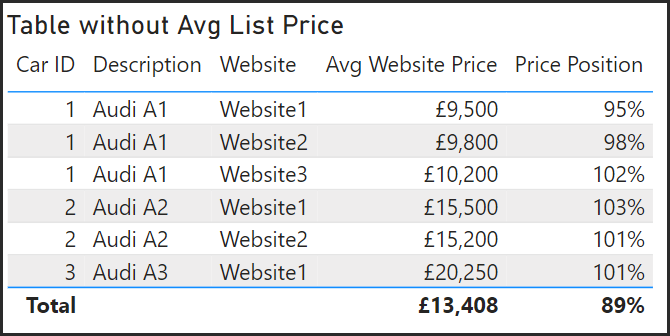
If I remove this measure, the table performs as expected, showing 6 rows.
It’s as if I want an option that says Do not show missing data!
Any thoughts greatly appreciated!
Thanks
Mark