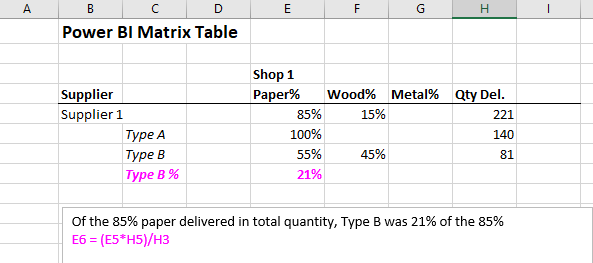
Hi All, I have a matrix table set up as below. But, I want to introduce a calculation that calculates Type B as a percentage of the Paper%. Is it possible to achieve this as I have it highlighted in pink text.
The formula to calculate the Paper% is:
Paper % = DIVIDE
(CALCULATE(SUM (Deliveries_All[ Qty Delivered]),Products[Packaging]=“Paper”),
SUM(Deliveries_All[ Qty Delivered]))
Wood% and Metal% are both calculated using the same DAX.
Hi @Dplex, I noticed you didn’t provide a PBIX file. Providing one will help users and experts find a solution to your inquiry faster and better.
A perfect initial question includes all of the following:
A clear explanation of the problem you are experiencing
A mockup of the results you want to achieve
Your current work-in-progress PBIX file
Your underlying data file (to allow us to go into Power Query if necessary to transform your data and/or data model – often DAX questions really end up being data modeling solutions)
Thanks, I unfortunately can’t provide a PBX file as it’s an actual company file with proprietary data. I’ll have to create a replica mock-up, change the values and submit on that basis. A big job. But thanks, I appreciate the complexity in answering such a question.
I actually found a workaround solution using a normal table.
I first created a measure filtering Paper as a percentage of Delivered Product.
then created a similar measure to just Sum Delivered Product, again Filtering for Paper.
I repeated these measures for Wood and Metal.
I dropped these into the table columns in the following order: Supplier Name, Product Type, Product Delivered Total, Paper Total, Paper %.
The table just then filtered down each subtotal prioritising columns from left to right. I repeated the last two columns accounting for Wood and Metal giving me each their respective subtotals by percent and Product Type which the Matrix table was unable to achieve.
See below: the Total Delivered in blue followed by subtotals of packaging type percents, broken down by Product Type on each row, Type A on row one with Type B on row two. I hope that makes sense.