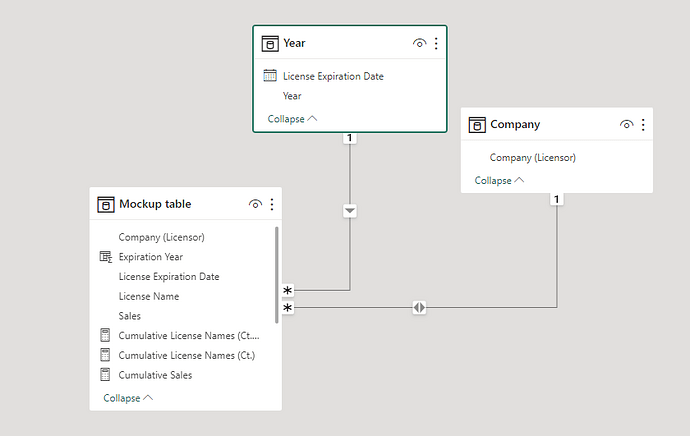
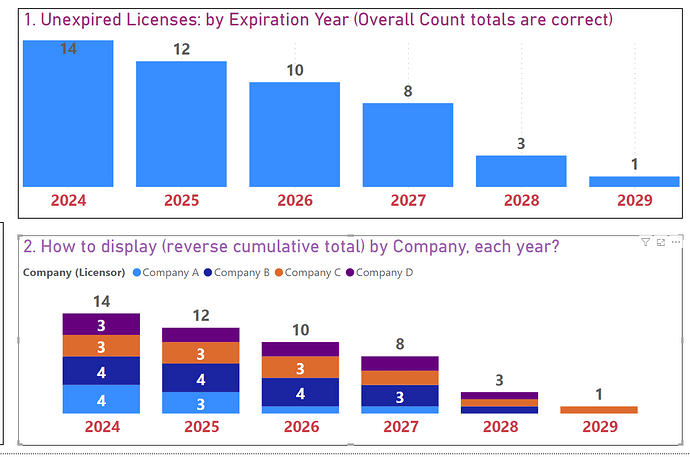
Refer to images below and attached simplified data model (and source table) for more details. Intent is to show reverse cumulative counts for all future years – and embed a Legend (Companies), where each bar shows the correct totals that comprise each years count of unexpired licenses:
In Chart #1, no Legend has been added. Correctly shows Reverse cumulative totals of unexpired Licenses by year:
In Chart #2, a Legend has been added – Company. But it scrambles the above counts of Licenses, and does not show the relative counts by Company:
DAX Problem - Add Legend to cluster Chart (counts).pbix (64.4 KB)
Mockup source file.xlsx (17.3 KB)
Hi @mdalton2100 ,
It’s context problem.
You need to create star shema - to add separate dimensions that you want to use - company and year
After that you need to switch your measure - to use this one (in PBI file I call RTest so you can check)
and use this dimensions on the second visuals to show
PBI file:
DAX Problem - Add Legend to cluster Chart (counts) v2.pbix (71.5 KB)
Hope that is what are you looking for.
Best regards,
Maja
1 Like
Thanks Maja, that was brilliant – though it is not entirely clear how my original solution attempt was causing a context issue in the first place. I will continue studying your solution.
Secondarily, I’m having a different issue pertaining to the same mock-up dataset. The topic title is “Reverse Cumulative Count: blank Bars when cross-filtering”, located a bit below in this topic section. Can you have a look at it? I would be very grateful. Best regards, mdalton.
For further investigation about that topic you can check Sam’s Mastering DAX calculation
(lesson: Working with one table versus many tables):


