Chad
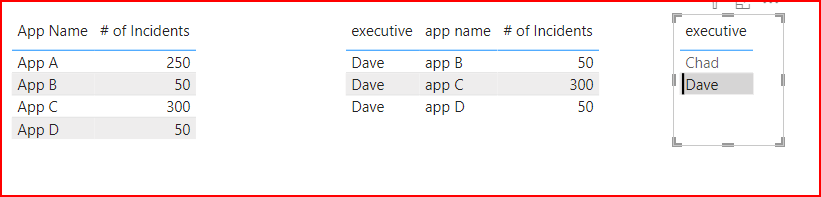
is the print screen the kind of visual you are looking for?
In your pbix I only see a table, no measure using the swith statement. The added visual is using a relationship between two tables
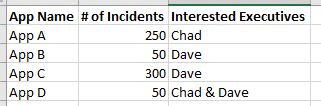
number of incident
table with the exectutives and their interest in the app
the first table has unique apps so you can create a relation ship
I had a switch true but I deleted it because I could not get it working.
The Switch True would assign an executive to a column and that would be that. You can’t assign two executives to the same App.
Your image is exactly what I’m trying to accomplish. Creating a secondary table is a good idea. I’m not sure why I didn’t think of it. The person i am working with is using Tableau and they had created a parameter to get the answer, so i think i then went with the same idea, i need a column or parameter
.