Please see the attached report. test.pbix (95.6 KB)
If i select 2023 the year matrix, the monthly matrix shoud show values for 2023, but i need a column at the end of the monthly matrix that show the total for all years (not be affected for any filters).
Any idea how to calculate at total field an place it after the Total field in a matrix visual.
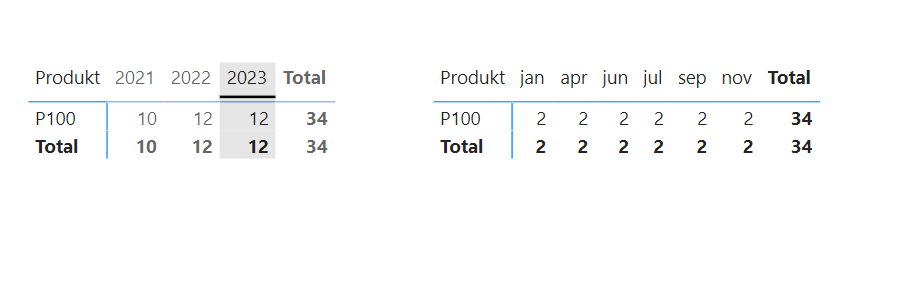
In Power BI, there’s no way to add/create one more extra “Total Column” alongside the already existing Total column. If you want, you can showcase the totals for all the 3 years in the already existing total column. Below is the measure alongwith the screenshot of the final results provided for the reference -
In the above screenshot, you’ll observe that, upon selecting the 2023 as a year in the first matrix, the second matrix evaluates the results at a monthly level and then at a total level, it showcases the results for all the 3 years. But the way you’re suggesting it, it’s not possible with the native visualization in Power BI.
I’m also attaching the working of the PBIX file for the reference purposes.
Wow, fantastic !! :-). I miss only one little number, ant the is the sum for the year after the last month, but before the Total. Then i have each month, total for the year, and total for all years ? Any idea how to get that total ?
As I already mentioned in the previous post, Power BI doesn’t have the feature of showcasing/creating multiple total columns i.e., showcasing “Totals for the Current Year” and then showcasing “Totals for all the 3 Years”.
Within one single column of a total, you can either showcase “Totals for the Current Year” or showcase “Totals for all the 3 Years”. Only one total column is permissible in Power BI with the native visualizations. So, the way you’re suggesting/requesting it is not possible with the given visualizations in Power BI.