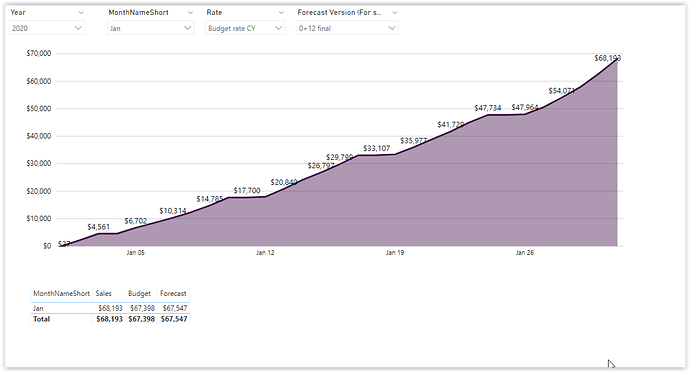
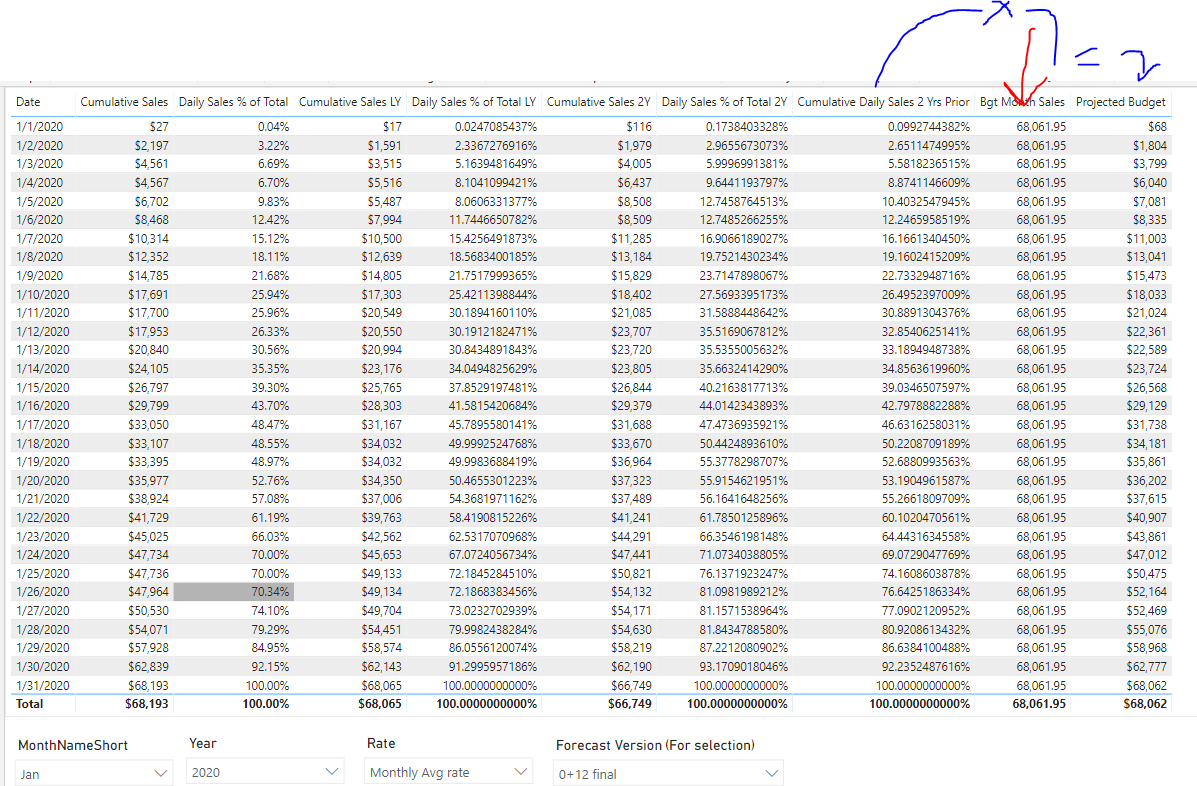
Hi, I’m trying to work out a scenario (which I have looked for in the forum but haven’t found).
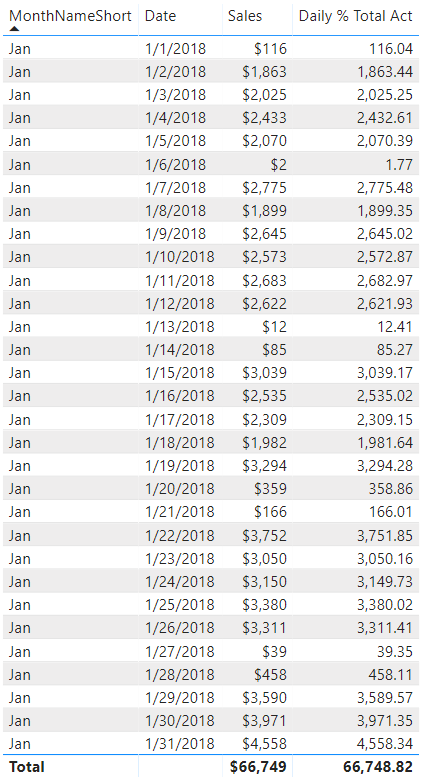
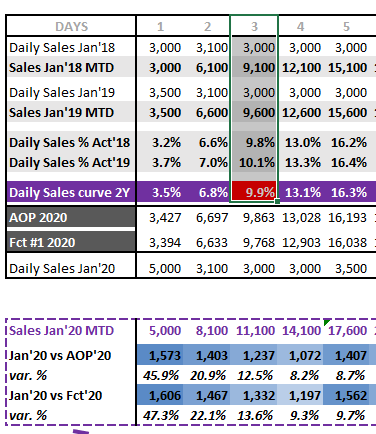
Data is composed of three years (2018, 2019 and 2020) - Jan and Feb contains Sales 2019 and 2020
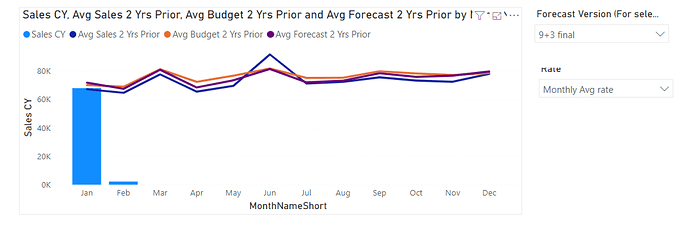
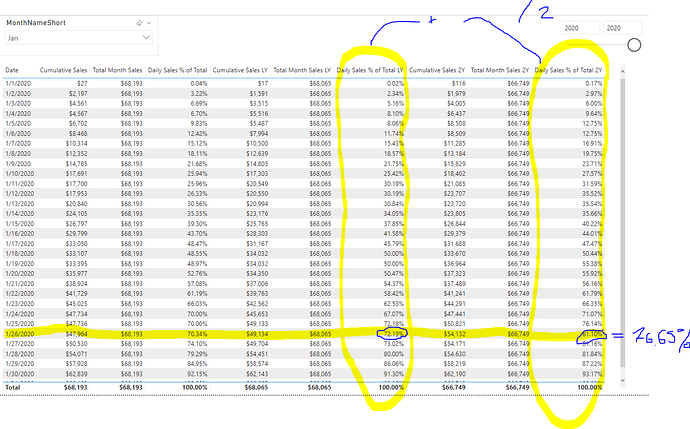
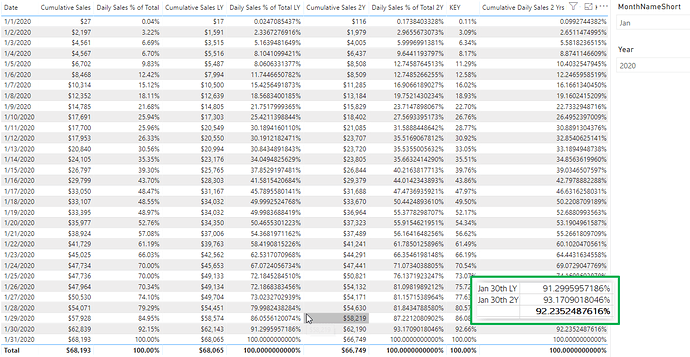
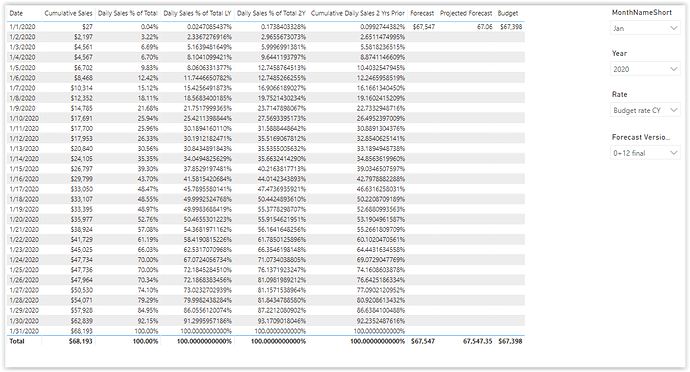
I want to showcase current year Sales by MonthNameShort as columns, and then add a line for the Average Sales 2 Yrs Prior curve by MonthNameShort.
Sales = DIVIDE( [Revenue 000’s], 1000)
Avg Sales = AVERAGEX (ALL(‘Calendar’[MonthNameShort] ), [Sales] )
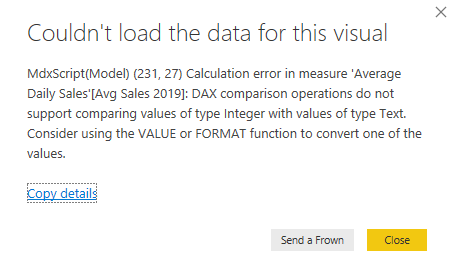
Avg Sales 2 Yrs Prior = AVERAGEX ( FILTER(‘Calendar’, ‘Calendar’[Year] = “2019” || “2018” ), [Sales])
The latter isn’t working - see below error message - don’t understand since Year filed in Calendar isn’t text:
So, Jan should show total Act Sales as column and Avg 2 Yrs Prior as line.
Once accomplished this, I would like to show the variance in $ and % for Act vs Avg 2 Yrs Prior curve in the same visual.
Last, add countries to be able to drill down.
Greetings,
Samuel

