Hi @msedlak
See my reaction below, see also attached PBIX :
AR Aging Example (original) correct totals.pbix (1.0 MB)
-
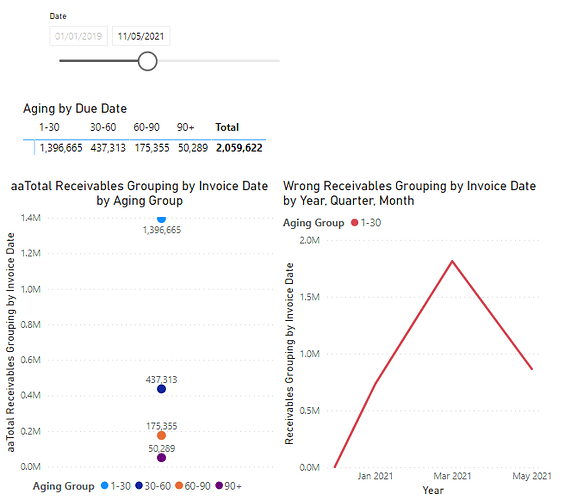
Incorrect totals, with this kind of calculations, is a known problem, as the context at the total needs to be derived/calculated from the row context of each individual line in the report.
The measure as stated below can be used:aaTotal Receivables Grouping by Invoice Date = SUMX( ADDCOLUMNS( SUMMARIZE( Invoices, Invoices[Customer #], Invoices[Invoice Date], Invoices[Due Date], Invoices[Order ID]), "Total Aging", [Receivables Grouping by Invoice Date]), [Total Aging]) -
This measure can be used in the reporting, for the calculation itself the “Receivables Grouping by Invoice Date”-measure is required.
For further information, see the link at the bottom. -
Just only for your information, I have made some alternative measures, with the EXACT same outcome, which can be found in the measure group ZDS, where DS Total Paid, DS Payment Date and DS Outstanding Invoices differ from your measures.
-
About the graph, not giving aging history, I might have a disappointing response:
The calculation of aging reporting is completely based upon ONE single date, which is set by the time slicer (like 11.05.2021).Other dates, as intended to be used in the graph, does not provide any context for aging calculation (given 11.05.2021, how should this aging calculation give an outcome for 19 March 2021) ?
-
Storing of measure aging calculations is not possible, and creating calculated columns or tables not an option.
-
If aging with only 4 historical periods will meet your request of aging development overtime, a solution might be (not tested, but should work):
- extend the Calendar table with 4 columns, with column names like DatePrevMonth, Date2MonthsBack, Date3MonthsBack and Date4MonthsBack, each dynamically connected to the Date (like something of PreviousMonth = ‘Calendar’[Date] - 30)
- makes 4 new sets of aging measures for each new period, connecting the 4 new “Selected date”, “Due Date” and “Payment Date” with the new column dates
- be aware that the report can become (very) slow with those additional measures
-
If not using the above option, the graph is in my opinion only possible for the slicer selected day.
I hope this answers your questions.
If you have further questions or remarks, please let me know.
Kind regards, JW
