This category is for all questions related to DAX calculations and formulas.
DAX is a deep topic that is important to master in Power BI so within this category we’ll look to solve many common questions and problems users have.
This category is for all questions related to DAX calculations and formulas.
DAX is a deep topic that is important to master in Power BI so within this category we’ll look to solve many common questions and problems users have.
Halo,
So I desperately need help. Is it impossible to Calculate a static value in power bi? For example, lets say I have a value for each day and I calculate an average, everytime you place this average measure over dates on a line graph, it keeps on calculating the average for every single day, which just gives you the value for that day again.
It seems everytime you plot this over date it SUMS the values for that day divided by 1 day(that particular day). I would like to calulate a static measure, meaning if I plot this measure over date, it gives me a straight line, life time average. How on earth do you do this?? I have already tried, ALL, ALLEXCEPT,… ect. Filter functions only help for filters in the query, it does not help for slicers or plotting. To give you another example, I once tried to calulate a static total for carats, but carats have different sizes, so I wanted to calculate the total carats for the entire month, because the purpose was to calculate the % carats for every single class over total carats for the month, but if I plotted this over the carat classes it gave me 100% for all classes, meaning, what Power bi did was total carats for every single class divided by total for that class and again with this, not any filter function worked.
Other related Questions, how do I calculate standard deviation, so that I can show the average with the two standard deviation lines on the graph with those typical railway and also, power bi does not seem to have standard deviation? Your help will be much appreciated.
Thank you
Well not completely static obviously, since it must change from period to period, but a life time average?
Hi,
I was doing one of your courses ‘solving analytical scenarios’ last night and you didnt explain really clearly on
the below fomula.
Customer Sales by Group =
CALCULATE( [Total Sales],
FILTER( VALUES( Customers[Customer Names] ),
COUNTROWS(
FILTER( ‘Customer Groups’,
RANKX( ALL( Customers[Customer Names] ), [Total Sales],DESC ) > ‘Customer Groups’[Min]
&& RANKX( ALL( Customers[Customer Names] ), [Total Sales], DESC ) <= ‘Customer Groups’[Max] ) )
0 ))
2 questions.
Why does there need be ‘countrows >0’ ? does the fomula not work if i dont have the countrows function there?
Why do i need all[customer names] in RANKX? if i remove all filters for Customers names by using ‘ALL’ fuction the total sales returns the same and i won’t be able to rank customers by ‘Sales Total’?
Appreciate your help.
Cheers
Hi,
I’m new to the forum so forgive it this the incorrect area. I have a Sales Table with all daily transactions including returns … When I determine gross margins what is the best way to exclude the returns. My only indication that the transaction is a return is a negative quantity in the Part Qty Invoiced
This post is part of the guidelines on how we can effectively utilize and manage the forum so all members can efficiently use it.
Just a quick question. Supposed we categorized customer as an existing or new based on joining date, then summing up sales every month.
How do I set up such condition?
Monthly sales should be based on such condition. For instance customer A joined 14 May 2021, A would become existing customer June 22, until then Customer A sales are regarded as New customer sales.
In that case do I need to put any formular on the look up table? How?
Appreciate your comments.
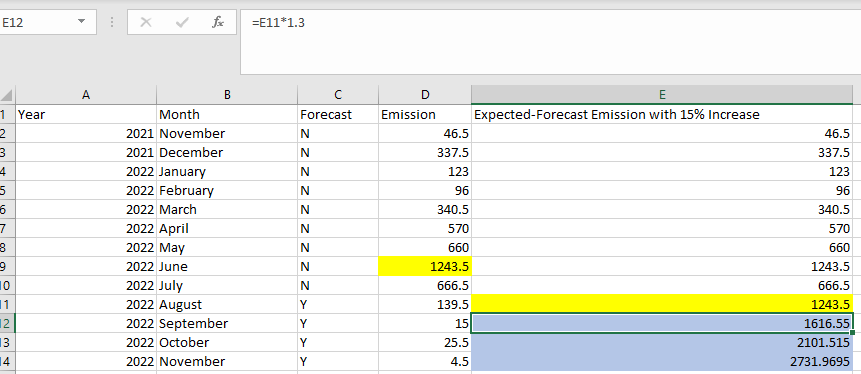
Hello, I need help with following questions:
want to create a measure that can calculate future emission (i.e. Forecast =Y) with 15 Percent of increase. To get the acquired future results I want to take June total emission from month of August as it considered as to peak emission month. For September forecast, I would like to multiply with 15% to August Emission value. Similarly for October forecast, I multiply 15% with September emission.
data is here–>
Data
Thankyou in anticipation,
Forecast Emission with 15% Increase =
VAR CurrentEmission = SUM ( Data[Emission] )
VAR CurrentMonth = SELECTEDVALUE ( data[Year_Month] )
VAR CurrentForcast = SELECTEDVALUE ( Data[Forecast] )
VAR PreviousMonths = FILTER ( ALLSELECTED ( Data ), data[Year_Month] < CurrentMonth )
VAR PreviousN_Months = FILTER ( PreviousMonths, Data[Forecast] = “N” )
VAR PreviousN_Month = MAXX ( PreviousN_Months, data[Year_Month] )
VAR PreviousN_Emission = SUMX ( FILTER ( PreviousN_Months, data[Year_Month] = PreviousN_Month ), Data[Emission] )
VAR YearMonthOnly = DISTINCT ( SELECTCOLUMNS ( PreviousMonths, “@YearMonth”, Data[Year_Month] ) )
VAR NumberOfY_Months = COUNTROWS ( FILTER ( YearMonthOnly, [@YearMonth] > PreviousN_Month && [@YearMonth] <= CurrentMonth ) ) + 1
VAR Result =
IF (
CurrentForcast = “N”,
CurrentEmission,
PreviousN_Emission * POWER ( 1.15, NumberOfY_Months )
)
RETURN
Result