Hi I have a database where I have cities and their populations by census year. I have created a Rankx formula that shows the rank by each fiscal year.
Census Pop Rank FY =
RANKX( ALL(tblCityPopulationByYear),[Pop FY],DESC,Dense)
where Pop FY -
Pop FY = VAR FYPopAvg = AVERAGEX( VALUES( dDate[Fiscal Year] ), [Total Population by Census Date] )
VAR PopAverageTotal = SUMMARIZE (dDate, dDate[Fiscal Year], “FY Pop Avg”, FYPopAvg )
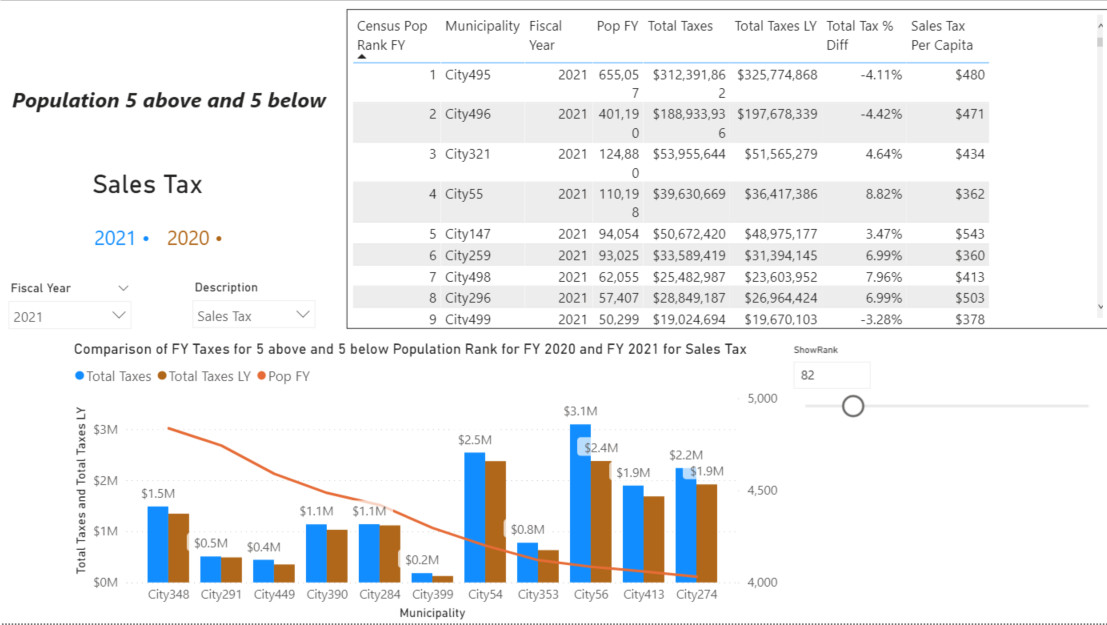
What I am wanting to do is to select a specific City and find those cities that are ranked 5 above and 5 below the selected city dynamically. What I have been doing is just finding the number of the rank and manually selecting the cities that are 5 above and 5 below that rank in the selection box of the field–with the is less than and is greater than
I can select the city in question by using the above formula and then with a slicer selecting the city that I want–When I put the formula in a card, it displays the Rank of the city that was selected. (in this example, it is 110) How can I then display in a table cities that are rank 104-116 (5 below 110 and 5 above 110) dynamically along with other data associated with the city?
Thank you–I am a beginner, so I hope this makes sense.
Good explanation of the problem and your desired outcome, but if you can please provide your PBIX file that will facilitate us getting you a quicker and more specific solution.
Hi @tjohnson, we aim to consistently improve the topics being posted on the forum to help you in getting a strong solution faster. While waiting for a response, here are some tips so you can get the most out of the forum and other Enterprise DNA resources.
Use the forum search to discover if your query has been asked before by another member.
When posting a topic with formula make sure that it is correctly formatted to preformatted text </>.
Use the proper category that best describes your topic
Provide as much context to a question as possible.
Include the masked demo pbix file, images of the entire scenario you are dealing with, screenshot of the data model, details of how you want to visualize a result, and any other supporting links and details.
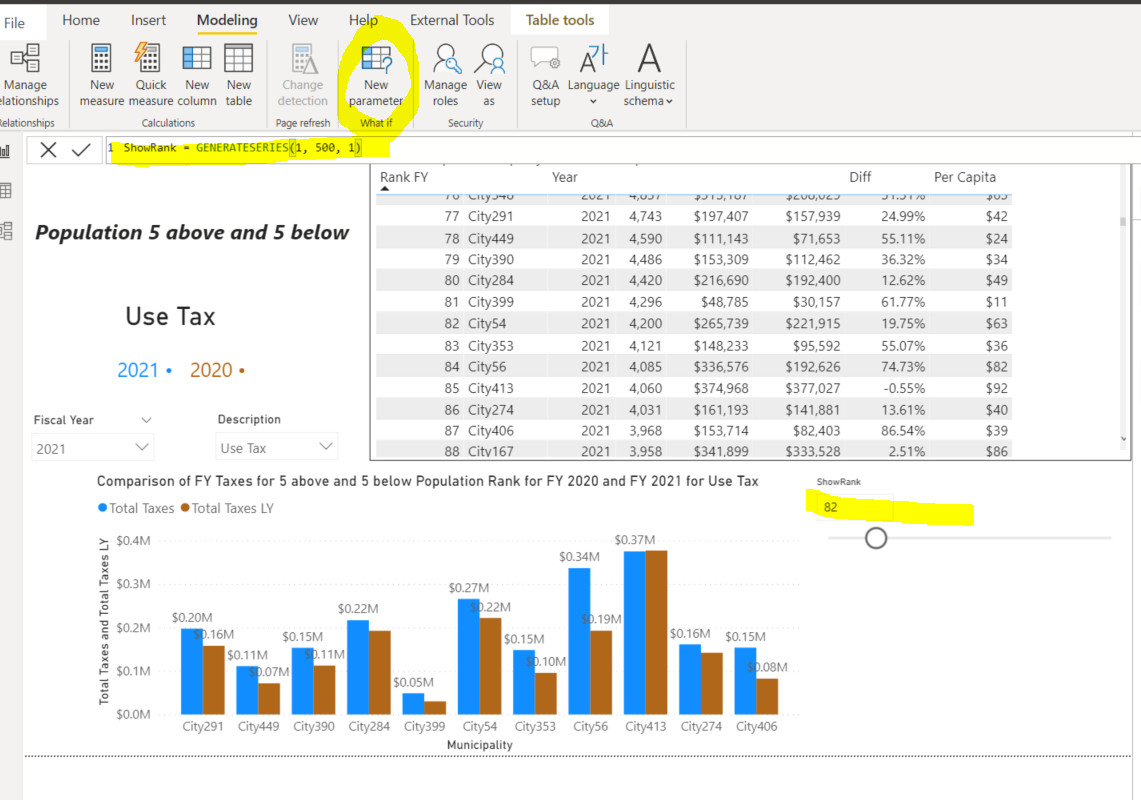
1.- Add Calculated Column to the table with the rank value
2.- Add What If Parameters with min value 1 and max value (max value of the rank)
3.- Use this Measure like reference and adapt to you table and field names
NAbove & NBelow =
VAR _ExtenderRank = 2
VAR _Rank = RankProduct[RankProduct Value]
VAR _ProductRank =
    SELECTEDVALUE ( Products[Product Ranked Top] )
RETURN
    IF (
        _ProductRank >= _Rank - _ExtenderRank
            && _ProductRank <= _Rank + _ExtenderRank,
        1
    )
3.- Update the variable _ExtenderRank to 5, the value you looking for or create another What If Parameter for dynamics selection
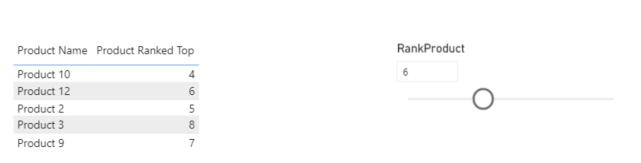
4.- Create you Visual
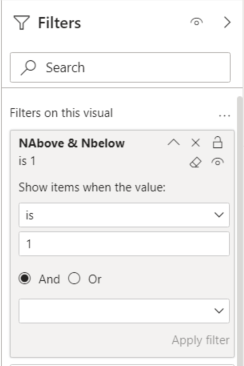
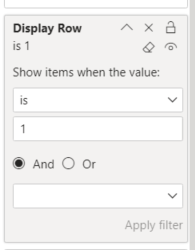
5.- Add this measure to the filter for the visual and set up equal to 1 like picture bellow
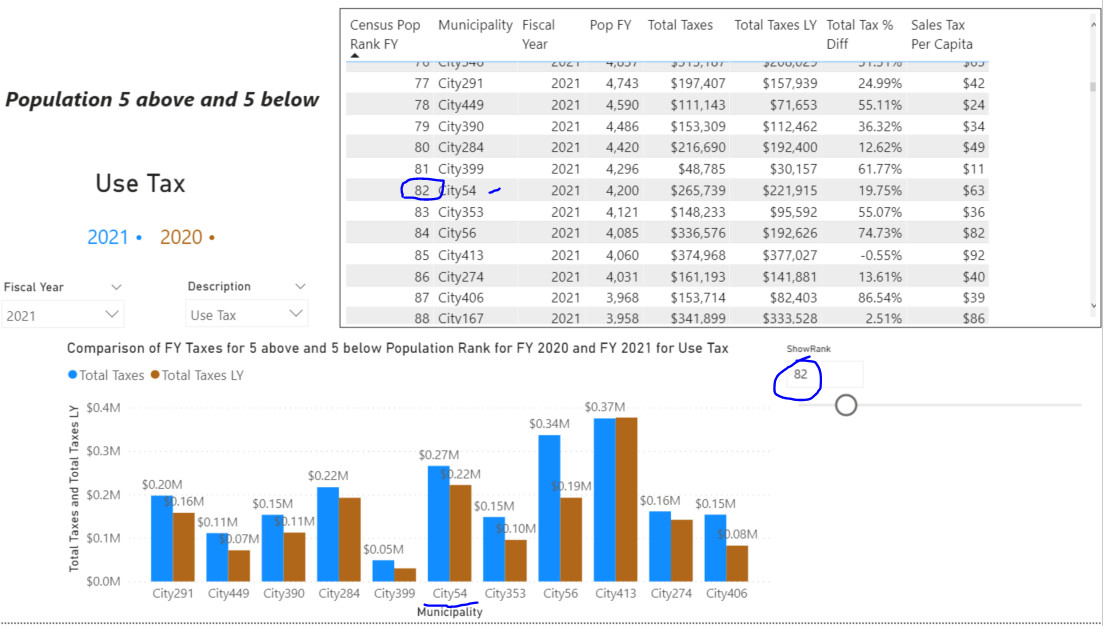
Sample (My extender value is 2 and the Parameter value is 6, the visual show product ranks between 4 (6-2) and 8 (6+2)
Thanx for your good explanation, but I have a question:
Do you mean that you need to rank the cities in each FY, or overall?
If you need to rank cities based on their population in each FY, I think it’s better to first rank them in each FY, and then by selecting the required FY, you will have the proper rank for different cities.
For ranking cities based on their population in each FY, you can use a formula like this:
 - Ranking Products in Each Company =
        CALCULATE(
                RANKX( ALL( 'Product'[Product] ) , [Inv Value $] , ,DESC ) ,
                      VALUES( 'Product'[Company]   ) )
In the above formula, I ranked products in each company based on their invoice value. I think using this formula helps you to rank the cities properly and then you can select 5 cities above/below the selected city.
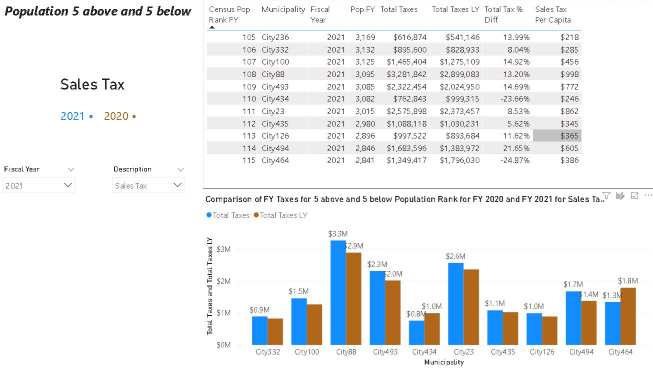
Good morning, Brian–I have tried to do as you suggested in revising my file so that it isn’t connected to my original data source. Hopefully I still have everything that is needed for this demonstration. There is a lot more data that I did not upload. The data is quite complex by my standards–I am very much a newbie. I am uploading a picture of what I am trying to achieve.
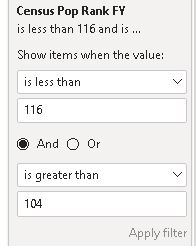
I am also uploading the excel file that I moved my data to–this is just the data that affects this visual–there is a lot more that I removed for this question. The way I have the City’s displayed by rank are through the filters–I have attached a screen shot. Please note that this is for the Sales Tax Tab–on the Use Tax tab–not all cities have Use Tax, therefore my City Rank that I am trying to compare has changed to 108. Rank 5 above and 5 below for Enterprise DNA Help.pbix (9.1 MB)
Hopefully this will help. I am very much a beginner, so I am sure I have not done everything correctly. The base information is coming from an Access database that I am connecting to. Thank you so much for your help!
Thank you so much for your response. I have uploaded some information for you to review–there were several responses, so I wanted for everyone who responded to have access to the information–it is in Brian’s post. I have not tried your suggestion yet, as I have been working on revising my PBIX file to upload. Thank you!
Thanks! This will be very helpful. Let’s see if @jbressan and @sedhosen have any revisions to make to their proposed solutions after seeing your specific data and data model. In looking at the latter, this may be more than a DAX issue, since I think the bi-directional relationship and the connections between dimension tables may prove problematic in providing accurate results, even if the DAX is correct.
I agree on the bi-directional. This is the only way I could make it “work”. As I said earlier, I am very much a newbie to Power BI. If you have any suggestions on how to change the relationship so that it isn’t bi-directional, I am open to it. Thank you!
Thank you so much for reaching out to try to help. I opened your file–and this is what is displayed. It is not showing what you were showing on the screen. All I did was open the file. I didn’t change anything. Is there something I need to do? Thank you!
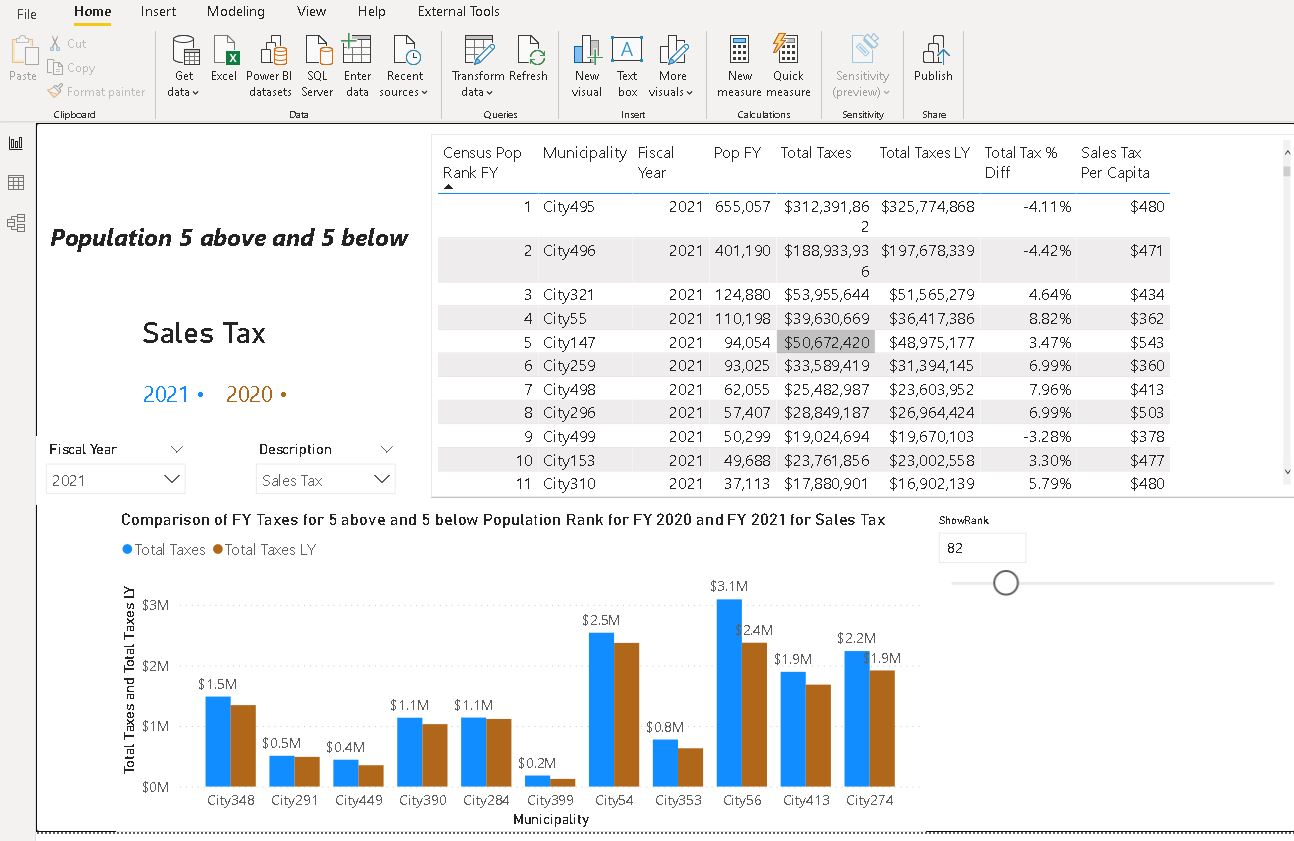
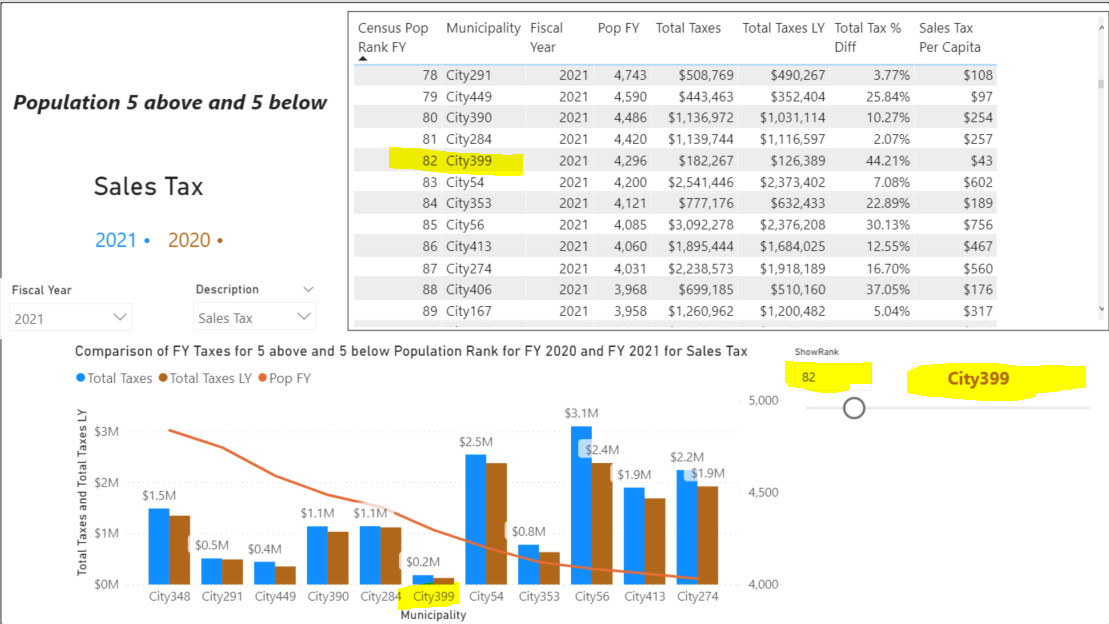
My screenshot the value are base Use Tax and on the PBIX file are on base Sales Tax. I didn’t filter the grid so you can validate the results. This is your Description slicer
I just add another dimension information with the rank
Dear @tjohnson,
Thanks for the extra information. It helped me to understand your issue much better.
Thanks to @BrianJ for considering my response.
Thanks to @jbressan for her thorough response. Actually, it was somehow innovative to me, and I learned from her way of thinking for solving this problem. I think that it is a good response to your problem.
At the time, I have no extra information to add to the mentioned ways, but I just have a question about the ranks (The first column in the table). Why some ranks are not listed in the table and some ranks are repeated?
For instance, there is no row for Census Pop Rank FY=163 making the chart show only 4 columns for the amounts above 160. On the other hand, there are two rows ranked 127 making the chart shows 6 columns for the below ranks.
I am working on it and if I found anything useful, I will tell you
Sedhosen
I really appreciate you pointing this out–there was an error in my data that I probably would have never noticed otherwise!! I had an error on the population for City 163
I am uploading the corrected file. It should now display rank 163. On the 127–the reason why 2 are listed is that there was a tie.
If you run the report on the Use Tax page with 165 as the selected rank–Rank 163 doesn’t show last years tax values–this is due to them not having use tax last year–I chased this for a little while trying to figure out why.
Let me know if you see anything else out of the ordinary!! I appreciate your comment and input!