I thought there was a video about creating 3YR Averages but I cannot seem to find it.
Hi @jmwdba
Could you please explain more what do you need?
Do you mean that you need to create 3 Years Average of sth, revenue for example?
Correct the revenue by month for the last 3 years by calendar year, I need to take the average by month.
Hi @jmwdba,
I think about a formula but without data it’s difficult to answer to you.
Have you tried something like that : AVERAGEX( VALUES( [Month & Year] ), [Total Revenue] ) ?
This kind of formula gives you the average monthly revenue.
Best regard,
Joaly
What I used for now is the following formula. The thing with Power BI is never knowing what the best approach is and if there is a better way to do something.
Registrations rolling average =
IF(
	ISFILTERED('Dates'[Date]),
	ERROR("Time intelligence quick measures can only be grouped or filtered by the Power BI-provided date hierarchy or primary date column."),
	VAR __LAST_DATE = ENDOFYEAR('Dates'[Date].[Date])
	VAR __DATE_PERIOD =
		DATESBETWEEN(
			'Dates'[Date].[Date],
			STARTOFYEAR(DATEADD(__LAST_DATE, -3, YEAR)),
			__LAST_DATE
		)
	RETURN
		AVERAGEX(
			CALCULATETABLE(SUMMARIZE(VALUES('Dates'), 'Dates'[Date].[Year]), __DATE_PERIOD),
			CALCULATE(
				[Registrations],
				ALL(
					'Dates'[Date].[QuarterNo],
					'Dates'[Date].[Quarter],
					'Dates'[Date].[MonthNo],
					'Dates'[Date].[Month],
					'Dates'[Date].[Day]
				)
			)
		)
)Is your formula working ?
If you want a rolling average, maybe you need to put Date instead of _LAST_DATE in the DATESBETWEEN ?
I’m not sure, without example it’s more difficult to answer to you…
Best regards,
Joaly
Hi @jmwdba, did the response provided by the other users and exerts help you solve your query? If not, how far did you get and what kind of help you need further? If yes, kindly mark as solution the answer that solved your query.
I hope that you are having a great experience using the Support Forum so far. Kindly take time to answer the Enterprise DNA Forum User Experience Survey, we hope you’ll give your insights on how we can further improve the Support forum. Thanks!
Hi @jmwdba, we’ve noticed that no response has been received from you since August 27. We just want to check if you still need further help with this post? In case there won’t be any activity on it in the next few days, we’ll be tagging this post as Solved.
Hi @jmwdba, due to inactivity, a response on this post has been tagged as “Solution”.
If you have a follow question or concern related to this topic, please remove the Solution tag first by clicking the three dots beside Reply and then untick the check box.
The measure provided above that is being used (also included below for reference) technically "works " for a portion of the year. Our organization’s fiscal year starts July 1 and ends June 30. What happens when we’re looking at the 3 year averages with our formula is that the values for July through December for FY19 are missing in the data set, which is causing incorrect averages for those months.
We would like to reflect our fiscal year start and end to be ‘July 1’ and ‘June 30’ instead of the standard ‘Jan 1’ to ‘Dec 31’ stard/end. Is this possible to do within the formula below? Or would there be a different measure that would need to be used to accommodate our fiscal year?
Registrations rolling average =
IF(
ISFILTERED(‘Dates’[Date]),
ERROR(“Time intelligence quick measures can only be grouped or filtered by the Power BI-provided date hierarchy or primary date column.”),
VAR __LAST_DATE = ENDOFYEAR(‘Dates’[Date].[Date])
VAR __DATE_PERIOD =
DATESBETWEEN(
‘Dates’[Date].[Date],
STARTOFYEAR(DATEADD(__LAST_DATE, -3, YEAR)),
__LAST_DATE
)
RETURN
AVERAGEX(
CALCULATETABLE(SUMMARIZE(VALUES(‘Dates’), ‘Dates’[Date].[Year]), __DATE_PERIOD),
CALCULATE(
[Registrations],
ALL(
‘Dates’[Date].[QuarterNo],
‘Dates’[Date].[Quarter],
‘Dates’[Date].[MonthNo],
‘Dates’[Date].[Month],
‘Dates’[Date].[Day]
)
)
)
)
Hi @jmwdba,
You are leveraging the auto date/time ‘feature’ in Power BI.
My advise would be to disable that (globally) always incorporate a proper date table in your model - if that includes a date column anywhere. Don’t forget to mark that, as a Date Table. Once that’s in place you can include FY columns in your calculations.
Two Examples from the M showcase category:
I hope this is helpful
1 Like
Hi @Melissa ,
Thanks for your response.
From your message, I disabled the “auto date/time” in the current report, as this is for a special report and auto data/time is not an issue in our other reports.
Also, I marked our ‘Dates’ table as a “Data Table”. This caused a couple of our rolling measures to break that were using some of the hierarchy components (i.e. ‘Dates’[Date].[Year], ‘Dates’[Date].[Month], etc). I set the ‘Date’ as the “Date Column” for the date table. However, when I try creating a new date hierarchy to be within the ‘Date’ field, it creates the hierarchy as a separate field…and I am unable to use the components of the hierarchy in the measure to fix them.
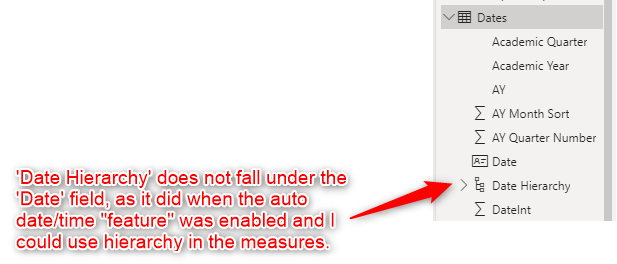
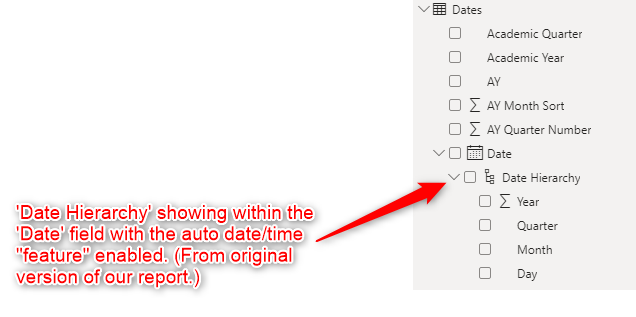
I’m trying to understand what I may be missing after I’ve disabled auto date/time and marked our ‘Dates’ table as a data table in order to get the hierarchy.
Regarding your comment, “Once that’s in place you can include FY columns in your calculations”, does that imply that date hierarchies wouldn’t be needed in the measures, but instead FY columns (i.e. FY Quarter, FY MonthNo, etc.) would replace them?
Thank you.
maybe providing your power bi file will help and using the date table that Mellisa M code will help too
Precisely, those columns are attributes of a Date and their purpose is to filter, slice and dice your data by. Found an older post that might be of interest to you, just amend it to fit your scenario.
Hi @Keith,
Unfortunately due to confidential organizational data, I am unable to share the data file. This would require approval from Info Security Team. Also, it would take some time to set up a report with dummy data to reflect the actual scenario.
Thanks.
Thanks for the information. I’ll see if I’m able to get the end result we’re looking for. I appreciate the help.
Generally - a sample of dummy data is good enough for forum members to work with. We don’t need to see your actual data (most of us are dealing with sensitive data, so we do understand that ![]() )
)
What is needed is something that represents your problem - so an example of the relative tables and measures.
The post below provides some excellent information on building out a dummy dataset for use in requesting help from the forum.
https://forum.enterprisedna.co/t/tip-tools-and-techniques-for-providing-pbix-files-with-your-forum-questions/17763
HI @jmwdba
Yes i understand that fully but the EDNA Team has put together a process that you can mask the data.
please see the below link
https://forum.enterprisedna.co/t/how-to-mask-sensitive-data-in-power-bi/7788
this will help us all
thanks
Keith
Hi @jmwdba,
Made some changes to your measure, hopefully you can translate this to your production file and it gets you the expected result. Nothing more I can do, really, without a sample file…
Note. Your dates table needs to include full Fiscal Years.
Registrations rolling average =
IF(
    ISFILTERED( 'Dates'[Date] ),
    ERROR( "Time intelligence quick measures can only be grouped or filtered by the Power BI-provided date hierarchy or primary date column." ),
    VAR __LAST_DATE =
        CALCULATE( MAX( 'Dates'[Date] ), DATESYTD( 'Dates'[Date], "30-6" ) )
    VAR __FIRST_DATE =
        CALCULATE(
            CALCULATE( MIN( 'Dates'[Date] ), DATESYTD( 'Dates'[Date], "30-6" ) ),
            DATEADD( 'Dates'[Date], -3, YEAR )
        )
    VAR __DATE_PERIOD =
        DATESBETWEEN( 'Dates'[Date], __FIRST_DATE, __LAST_DATE )
    RETURN
        AVERAGEX(
            CALCULATETABLE(
                SUMMARIZE( 'Dates', 'Dates'[Fiscal Year] ),
                __DATE_PERIOD
            ),
            CALCULATE( [Registrations], ALLEXCEPT( 'Dates', 'Dates'[Fiscal Year] ) )
        )
)
I hope this is helpful
Hello @jmwdba, good to see that you are having progress with your inquiry. Did the response from the users and experts help you solve your inquiry?
If yes, kindly mark as solution the answer that solved your query.
If not, like @Keith mentioned above, kindly send us your masked PBIX file.
Here are some videos that may help you masking sensitive data and create datasets and data models representative of your problem:

