Hi All,
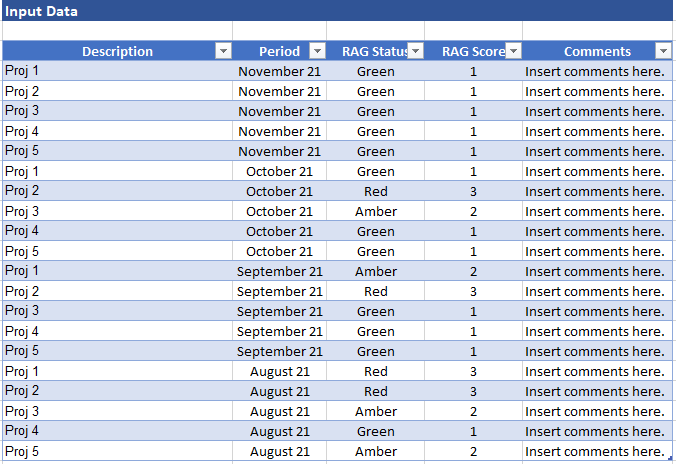
I need to generate a very simple table but for some reason, I can’t seem to get my head around this. Basically, I have a table that includes RAG status by project over period (months). See image below:

Then, I need to calculate a change in status between months (using the RAG Score) for each project and show a trend status over the past 3 months. See image below:

Basically, if the RAG score difference between months
- is >0 then green up arrow
- is = 0 then amber dash
- is <0 then red down arrow.
I have attached the pbix and the input data files where I have started to construct this and the main problems I am having are:
- setting the Month -1, Month -2, Month -3 variables
- filtering the score using the above variables.
I hope you can understand the context and the issues I am having. Any direction and help will be appreciated.
Thank you in advance.
Trend Status Example.pbix (41.0 KB)
Trend Status Example.xlsx (13.4 KB)
