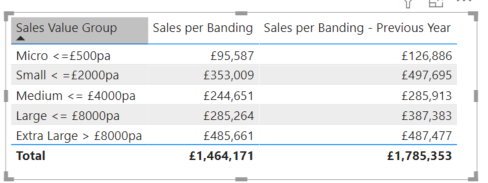
Hello @AliB,
Thank You for posting your query onto the Forum.
Is you banding logic still the same i.e. like it was in the previous post and only want to calculate the Last 12 Months Running Total? If so, then firstly your Running Totals measure should be something like this for Current and Previous Years -
Running Total Last 12M CY =
CALCULATE( [Total Sales] ,
    DATESINPERIOD(
        Dates[Date] ,
        MAX( Dates[Date] ) ,
        -12 ,
        MONTH ) )


Running Total Last 12M LY =
CALCULATE( [Running Total Last 12M CY] ,
    DATEADD( Dates[Date] , -1 , YEAR ) )
Once you create the above measures then you can consider them inside the Banding logic. Or if you don’t want to create Running Totals measures separately and want to add them inside the Banding logic then you can create the measures something like this for Current and Previous Years.
Sales per Banding L12M RT- CY =
CALCULATE(
    CALCULATE( [Total Sales] ,
        DATESINPERIOD(
             Dates[Date] ,
             MAX( Dates[Date] ) ,
             -12 ,
             MONTH ) ) ,
     FILTER( VALUES( Customers[Customer] ) ,
          COUNTROWS(
               FILTER( 'Sales Banding' ],
                   [Avg Sales] >= 'Sales Banding'[Min] &&
                   [Avg Sales] < 'Sales Banding'[Max] ) ) > 0 ) )


Sales per Banding L12M RT - PY =
CALCULATE(
    CALCULATE(
        CALCULATE( [Total Sales] ,
             DATESINPERIOD(
                 Dates[Date] ,
                 MAX( Dates[Date] ) ,
                 -12 ,
                 MONTH ) ) ,
         DATEADD( Dates[Date] , -1 , YEAR ) ) ,
     FILTER( VALUES( Customers[Customer] ) ,
          COUNTROWS(
               FILTER( 'Sales Banding' ,
                   [Avg Sales] >= 'Sales Banding'[Min] &&
                   [Avg Sales] < 'Sales Banding'[Max] ) ) > 0 ) )
Also rather than considering “Month & Year” category in a slicer you need to select only “Month” category since you already have segmentated or banded your data into the Matrix visual based on Years as well by putting them into the columns section.
The reason why your measure must not be rendering the correct result is because within the single “CALCULATE()” function you’re putting two conditions i.e. first to evaluate the Running Totals Last 12 Months and then also of last one year. I’ve used your measure in my PBIX file and you can cross-verify the results alongwith the results that I’ve evaluated with my measures.
I’m also attaching the working of the PBIX file for the reference.
Hoping you find this useful and meets your requirements that you’ve been looking for. 
Important Note’s:
1). In my working PBIX file, I’ve just changed the condition to Running Totals Last 3 Months rather than 12 months since my dataset is small but the logic remains the same in it’s entirety.
2). Refer the “Running Totals L3M - Check” page to cross-verify the results.
3). While posting your query, please include either the working or the example PBIX file for the reference of the forum members so that everyone can assist you in a better and efficient manner. When files are not included it consumes the time of the memebrs to create the files by themselves in order to provide the solutions.
Thanks and Warm Regards,
Harsh
Grouping and Segmenting - Harsh.pbix (613.1 KB)


