Hi,
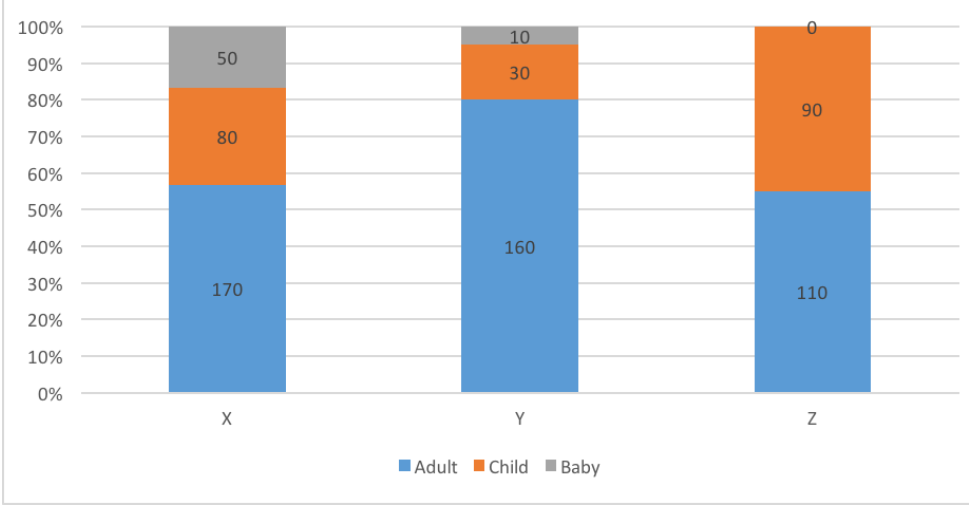
I need to obtain a chart identical to this one but I want show values not %
I’m using Power BI Report Server not Power BI Desktop.
I appreciate any help you can give me.
Regards
Joao Monteiro
Hi,
I need to obtain a chart identical to this one but I want show values not %
I’m using Power BI Report Server not Power BI Desktop.
I appreciate any help you can give me.
Regards
Joao Monteiro
Hi @JoaoMonteiro. Not sure if Tabular Editor works with PBIXs developed/deployed to Power BI Report Server, but if so, then you may be able to leverage calculation groups to set the formatting string in a fashion similar to today’s Havens Consulting video.
Adding Dynamic Multi Value Data Labels to Visuals - YouTube
Hope this helps.
Greg
Hi @JoaoMonteiro, did the response provided by @Greg help you solve your query? If not, how far did you get and what kind of help you need further? If yes, kindly mark as solution the answer that solved your query.
I hope that you are having a great experience using the Support Forum so far. Kindly take time to answer the Enterprise DNA Forum User Experience Survey, we hope you’ll give your insights on how we can further improve the Support forum. Thanks!
Hi @Greg
I don’t think I can use the Tabular Editor with the Power BI Report Server, however I am very grateful for the video you shared.
Thank you
Regards
Joao Monteiro
This can more than likely be accomplished in Charticulator. Please post a PBIX file, and I would be happy to put something together.
Thanks
Jarrett
Hi @JarrettM ,
I had also thought about using the Charticulator, but the problem is that I must use Power BI rs, in addition, we do not have permission to install any visual on our machines.
Thanks
Joao M
Can you please post a work-in-progress PBIX? I have a couple of kludgy ideas I want to test that fall into the “it’s not stupid if it works” category.
Hi @BrianJ ,
I cannot send the original PBIX file for compliance reasons, but the one I send serves exactly the same purpose.
Sales Demo.pbix (5.0 MB)
I really appreciate your effort.
Thank you very much
Regards
JoaoM
Thanks for the file. My kludgy idea of overlaying multiple charts didn’t work. The only other thing I can think of since Charticulator is not an option is R. You can create R visuals within PBI without installing any custom visual files. You’ll just need the base R installation and the ggplot2 package. Ironically, R defaults to the raw numbers in the data labels for this type of chart, and you have to do a bit more work to get % labels.
I hope this is helpful.
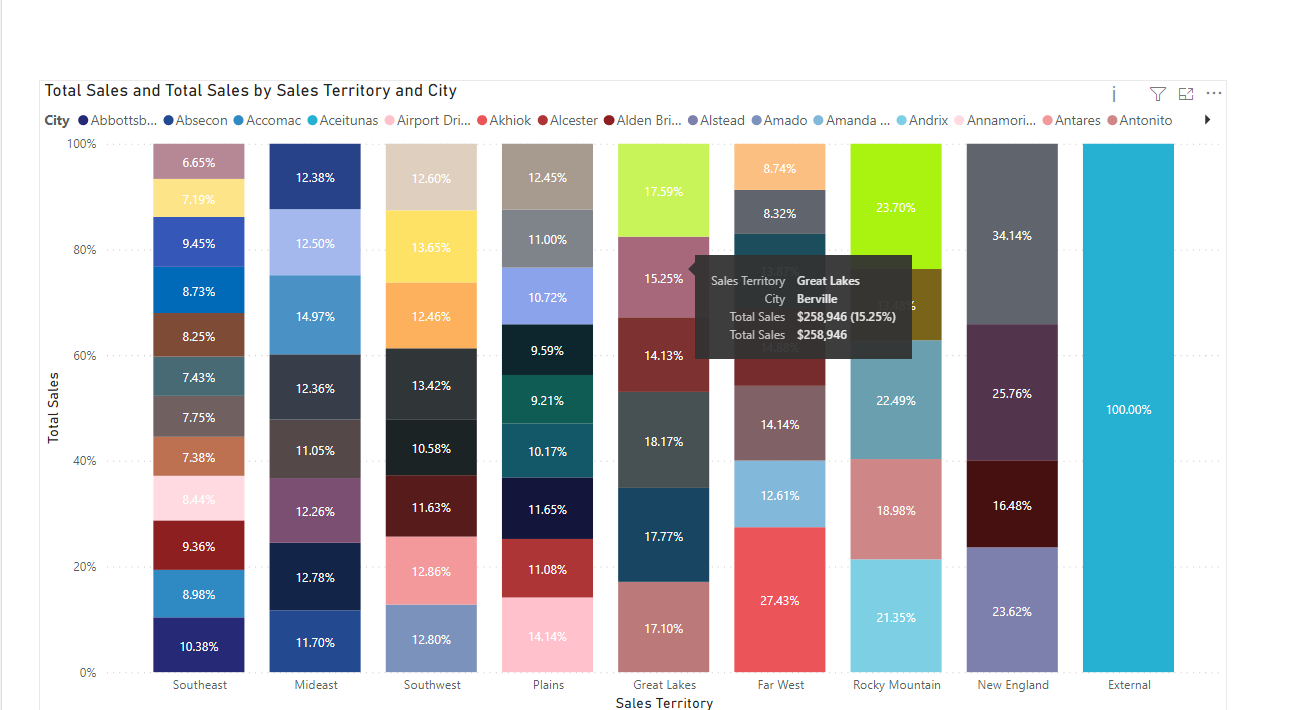
@JoaoMonteiro The other work around would be to make use either of the Report level tooltips or just the default tooltips to show the Values.