I want to draw a 1:M relationship between dimension and fact table.
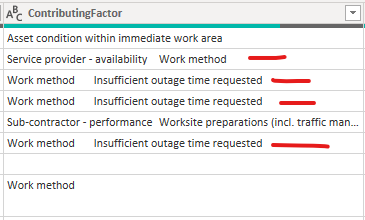
The fact table contains a column that may have multiple values in a single cell separated by tab as shown in the picture:
The red line shows multiple values in a cell. I also got unique values of the column as a dimension table. Now I am not sure how should I draw 1:M relationship between dimension and fact table. Could anyone please help me in overcoming the issue?
@leo_89
Your contributing factor dim table has one occurrence for each item in that table so you connect fact table just fine where you have multiple occurrences. one to many .
just join contributing factor(dim Table) to the contributingfactor in the the fact table.
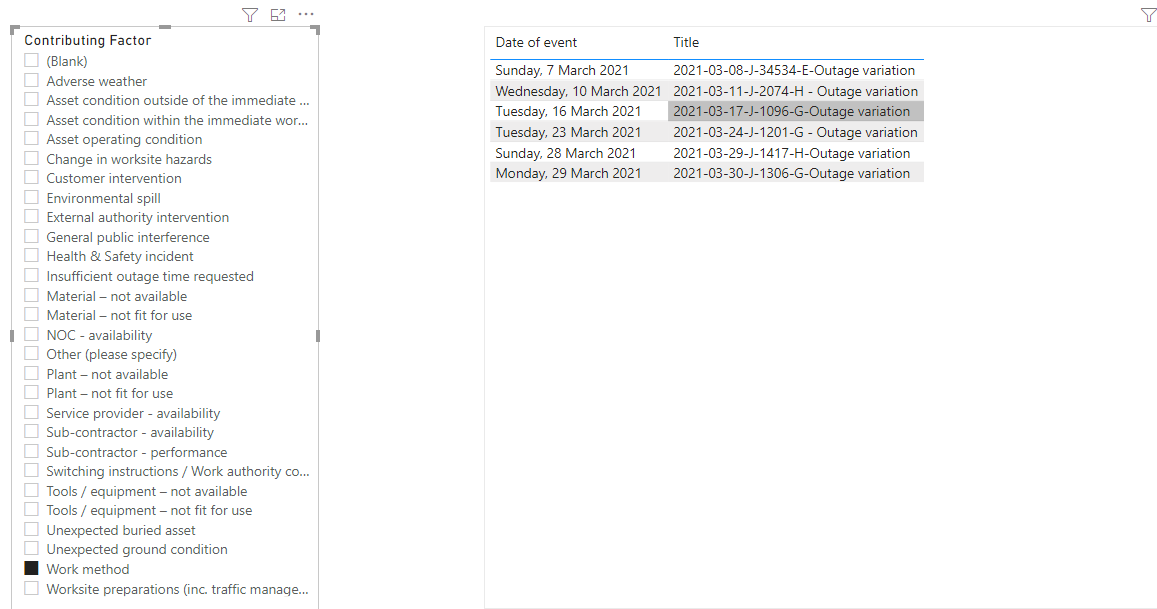
The problem is that when I use the dimension table (contributingfactor) as a slicer, and select value from it. It only shows the record of fact table where contributingfactor value appears itself. For example, as shown in picture below:
In the above picture, it only shows those records of work method when ‘work method’ appears alone in fact table. It does not show those values when ‘work method’ appears with other values. For example, it did not show record when contributing factor value in fact table is ‘work method’ and ‘Service provider -availability’.
Easy way make a copy(reference) of your fact table (rename the table) and remove all the other columns except the contributing factor column and then remove duplicates.
there is your new dim table
Before you can get the relationship set properly here, you’re going to need to do some data prep on both the fact and dimension table. You can’t have two or more values in the same field and have the relationship work properly.
What you’re going to need to do is split by delimiter (where your delimiter is the multiple spaces that separate the values in Contributing Factor) and then unpivot the resulting columns. Once you do that for your fact table, and then create a dimension table from the referenced fact table and remove duplicates, you should be good to go.
If you need any assistance with how to do this, please also provide the underlying data file associated with your PBIX file, so that I can rework the structure in Power Query.
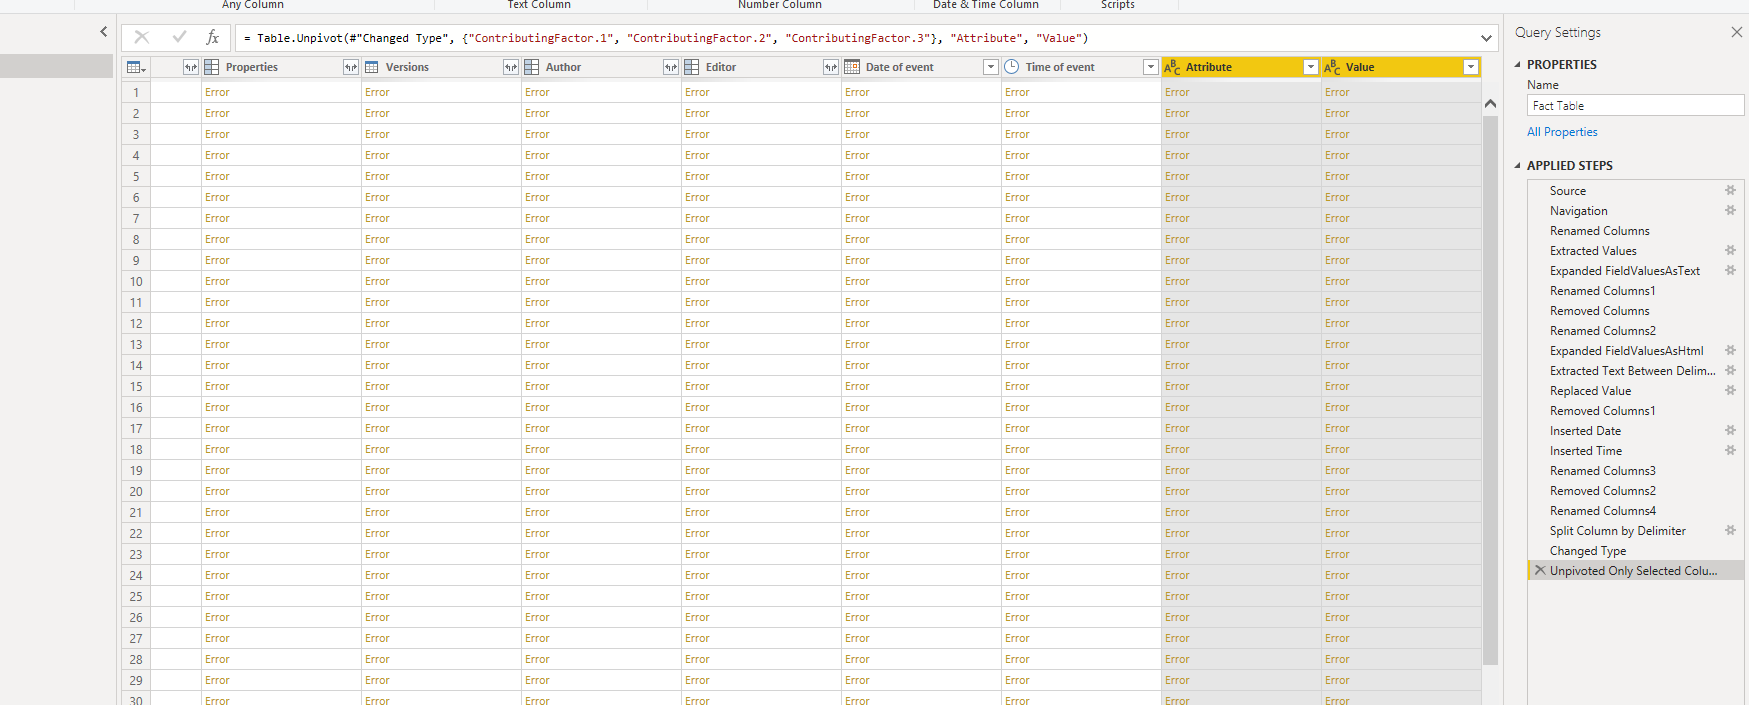
@BrianJ , thanks for the reply. I followed the instruction. When I unpivot the resulting columns, all spreadsheet turned into error as shown in the picture
Yes, totally appreciate your efforts in providing the PBIX file. However, in order to go into PQ and do some transformations, I need access to the underlying data. In most cases, that’s an Excel or PBIX file. However, in your case it’s coming in directly from your Sharepoint, which I obviously can’t access.
I have some tools that will let me work around this, but won’t be able to do it tonight since I need to get Week #3 of PBI Accelerator launched. If you’re able to download the data from SP to Excel and provide that file, that would definitely be helpful.
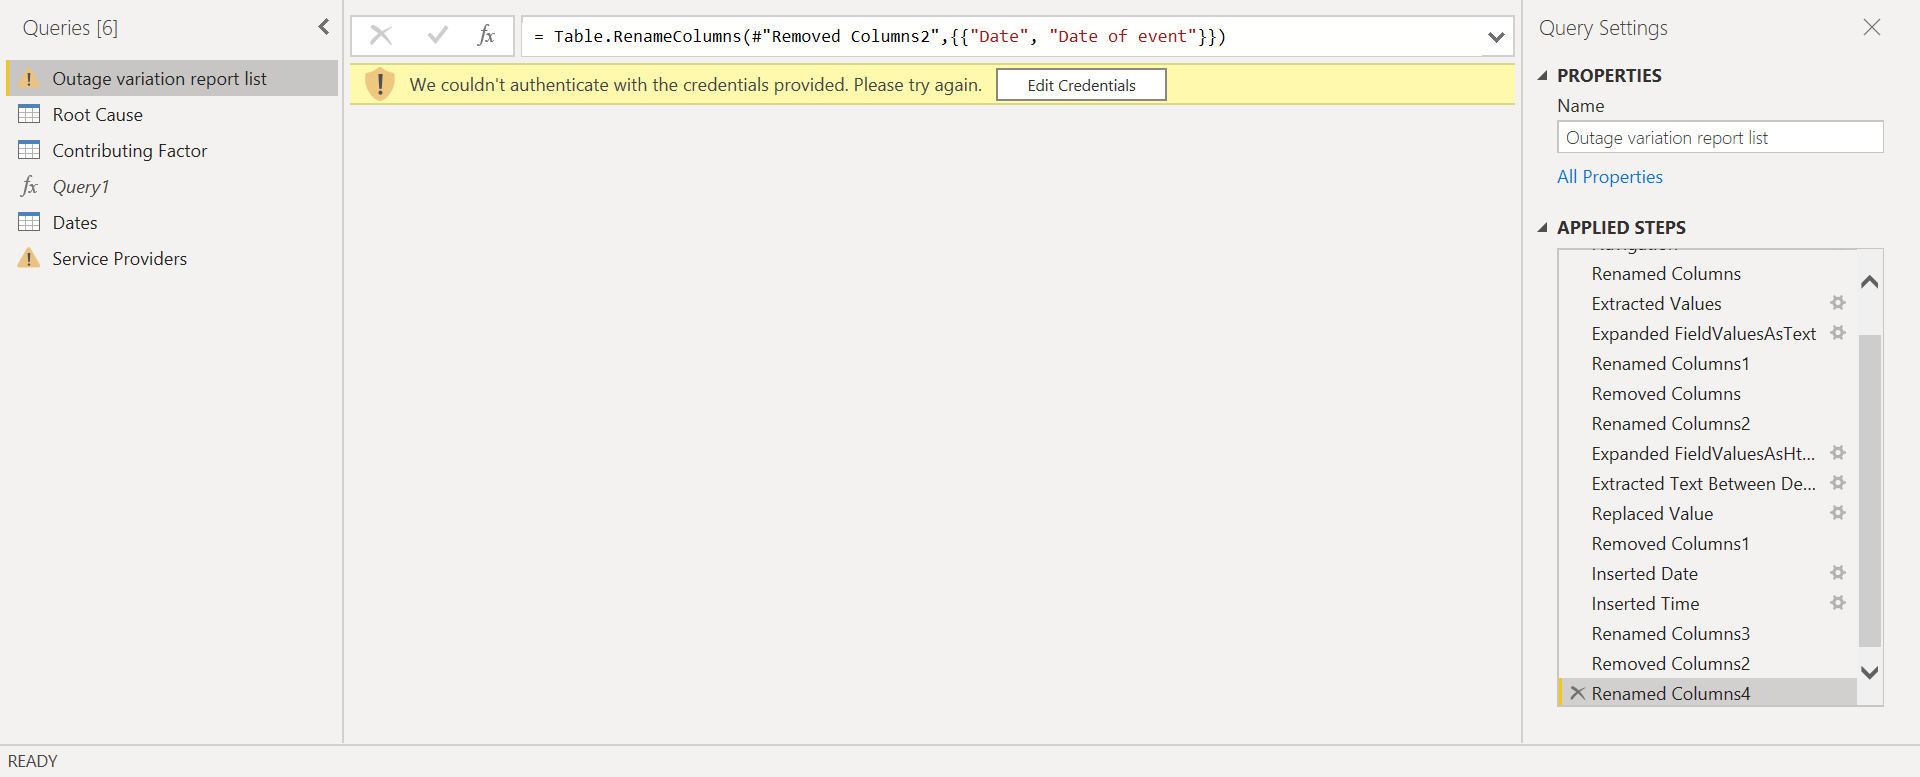
@BrianJ , I think the issue is in data that comes from sharepoint. I followed your instructions on excel based .pibx file and it worked. I will debug my file.