Hello @ScottTPA,
Thank You for posting your query onto the Forum.
I’m providing couple of methods to achieve the solution -
1. Showcasing the results at a Weekly Level.
To achieve this type of results simply write the measures as provided below -
Total Sales =
SUM( 'Sales-sample'[Amount] )


No Of Workdays =
VAR _No_Of_Workdays =
COUNTROWS(
    FILTER( DateTable ,
        DateTable[IsWorkingDay] ) )

RETURN
IF( ISBLANK( [Total Sales] ) ,
    BLANK() ,
    _No_Of_Workdays )


No Of Workdays - Net =
SUMX(
    SUMMARIZE(
        DateTable ,
        DateTable[Date] ,
        "@Total" ,
        [No Of Workdays] ) ,
    [@Total]
)


Average Sales =
DIVIDE( [Weekly Sales.] , [No Of Workdays - Net] , 0 )
The reason why I wrote the “No Of Workdays - Net” measure is just to fix the Grand Total of “No Of Workdays”. If you want the results at a row level and want to avoid the results at a Grand Total level then you can simply avoid writing that measure.
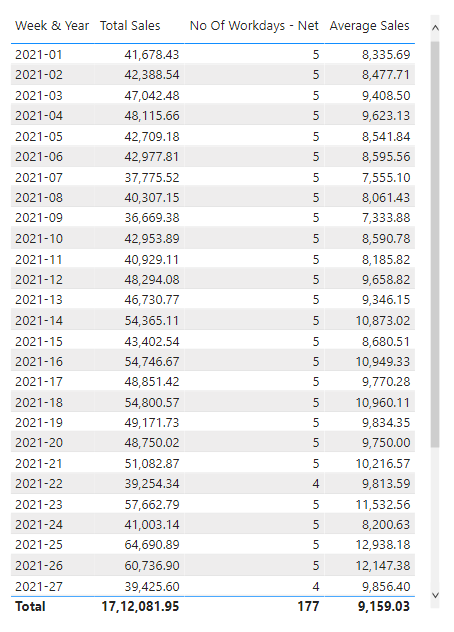
So once this measures are written just drag the “Week & Year” column from the Date table and the measures which we created into the matrix. These type of method simply consolidate the numbers at a weekly level and then divide it with the number of working days to achieve the “Average Results”. Below is the screenshot of the results provided for the reference -
1. Showcasing the results at a Daily Level.
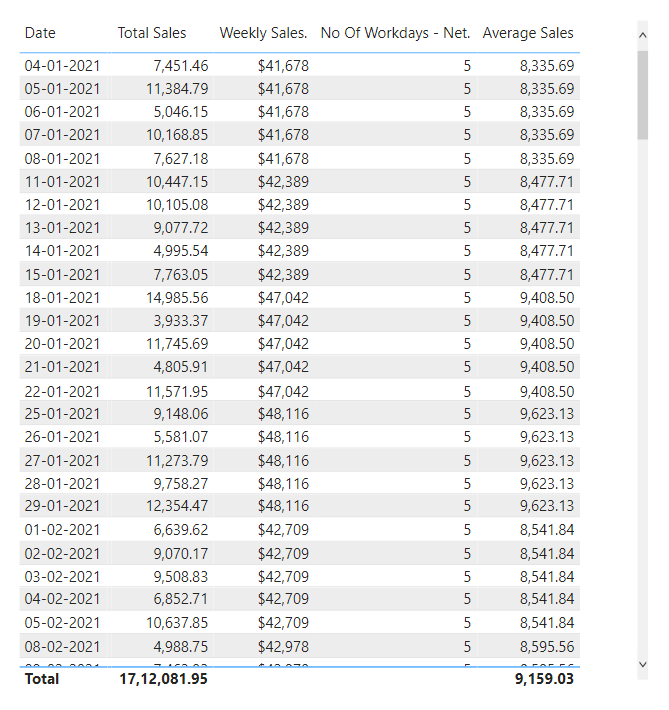
But now let’s say you want to analyze the results at a daily level i.e. something like this. Below is the screenshot provided for the reference -
So in this case, numbers are at a granular level and needs to be consolidated at a weekly level.
In that case, there’re two types of methods available one is “Measure Branching” technique and other one is “Variable Technique”. Let’s see both of those techniques and the measures that are provided below for the reference -
1. Measure Branching Technique
Weekly Sales. =
IF( ISBLANK( [Total Sales] ) ,
    BLANK() ,
    CALCULATE( [Total Sales] ,
        ALLEXCEPT( DateTable , DateTable[Week & Year] ) ) )


No Of Workdays - Net. =
IF( ISBLANK( [Total Sales] ) ,
    BLANK() ,
    CALCULATE( [No Of Workdays - Net] ,
        ALLEXCEPT( DateTable , DateTable[Week & Year] ) ) )


Average Sales =
DIVIDE( [Weekly Sales.] , [No Of Workdays - Net.] , 0 )
2. Variables Technique -
Using this technique, you can avoid writing so many measures i.e. right from “No Of Workdays - Net” measure till the last above provided measure. Everything will be covered under the one roof/measure. Below is the consolidated measure provided for the reference -
Average Sales Using Variables =
VAR _Calculation_Of_No_Of_Workdays_Net =
CALCULATE(
    VAR _No_Of_Workdays_Net =
        SUMX(
            SUMMARIZE(
                DateTable ,
                DateTable[Date] ,
                "@Total" ,
                [No Of Workdays] ) ,
            [@Total] )

RETURN
    _No_Of_Workdays_Net ,
        ALLEXCEPT( DateTable , DateTable[Week & Year] ) )


VAR _Weekly_Sales =
CALCULATE( [Total Sales] ,
        ALLEXCEPT( DateTable , DateTable[Week & Year] ) )


RETURN
IF( ISBLANK( [Total Sales] ) ,
    BLANK() ,
    DIVIDE( _Weekly_Sales , _Calculation_Of_No_Of_Workdays_Net , 0 ) )
Now, once this measure is written, just drag the “Date”, “Week & Year” fields from the Date table and the measure which we’ve created and if you don’t want to showcase the “Week & Year” field in your table visual then hide that field.
So you can adopt either of the approach to showcase the results as per the scenario.
I’m also attaching the working of the PBIX file for the reference alongwith some of the reference links of the posts/videos that might be useful to you.
Hoping you find this useful and meets your requirements that you’ve been looking for. ![]()
Important Note: I replaced the old M Code of Date table with the new M Code of Date table.
Sample Dashboard v09-13-2021 - Harsh.pbix (278.6 KB)

