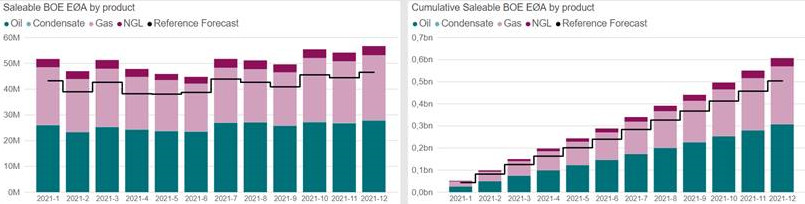
Hi, I have a visual as ‘Line and Stacked Column Chart’ that when published on Power BI Service, misses some of the measures.
I changed the visual to Table and Ribbon line and measures are still there.
what is the reason some of the measures do not make it show up?
Hi, thank you for quick reply.
I am affraid I cannot provide the PBix due to sensitive data, but also Direct Query to a database one would need access to. I will try to download some data in an excel and recreate some of the measures and visuals. That might make some time. In meantime, if you have any suggestion, i would be very grateful.
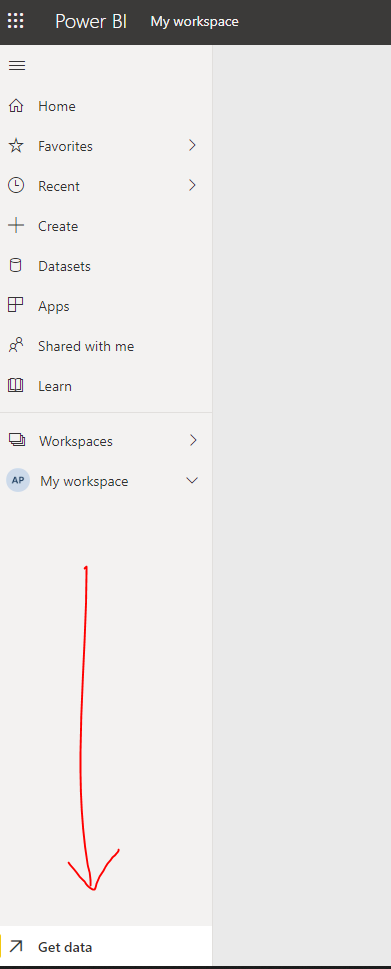
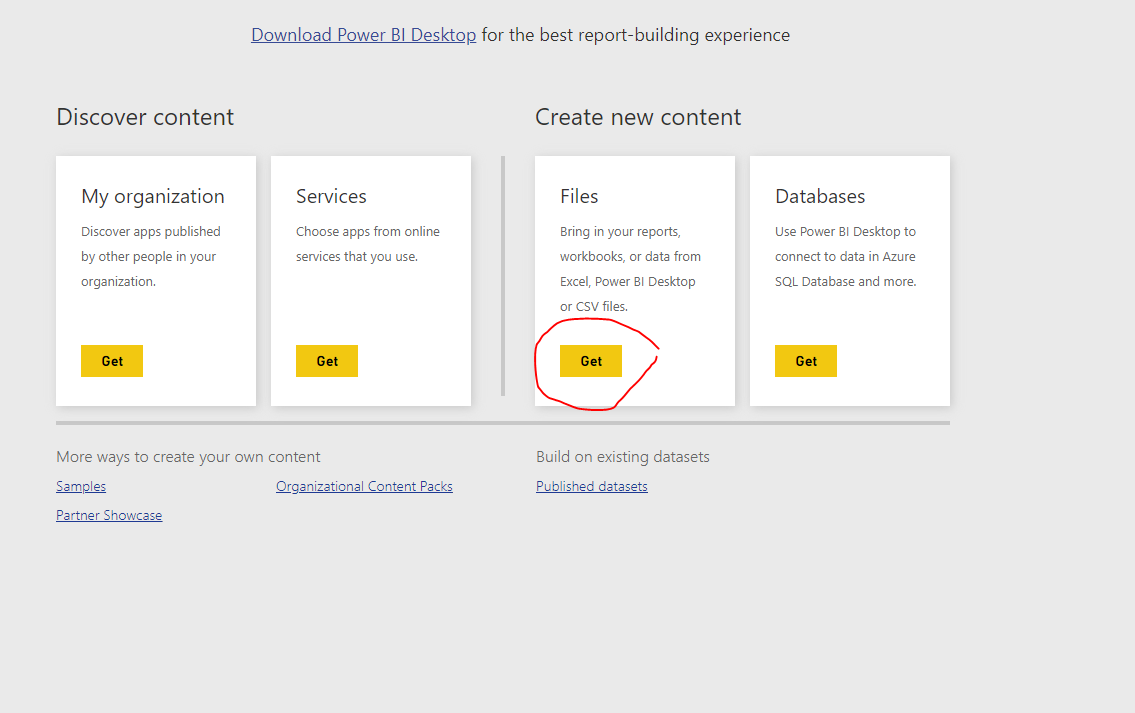
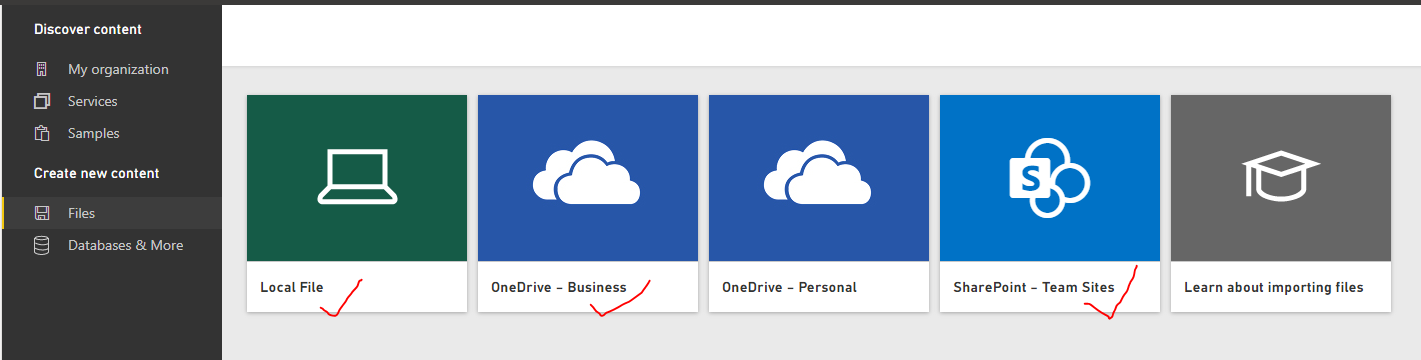
No worries, whenever you can. Meanwhile, instead of publishing the file to the Service, get the file in a workspace using Get Data. this is the option that you will see at the bottom left of the page, in Service.
For this to work effectively, you can choose to save the local copy of the file in OneDrive or in SharePoint. Alternatively you can also “get data” from your local machine using the local copy.
One you retrieve the .pbix to service using the method specified above, have a look at the functionality to check if the measure appears or not. If there is an error message associated with the visual, please let us know.
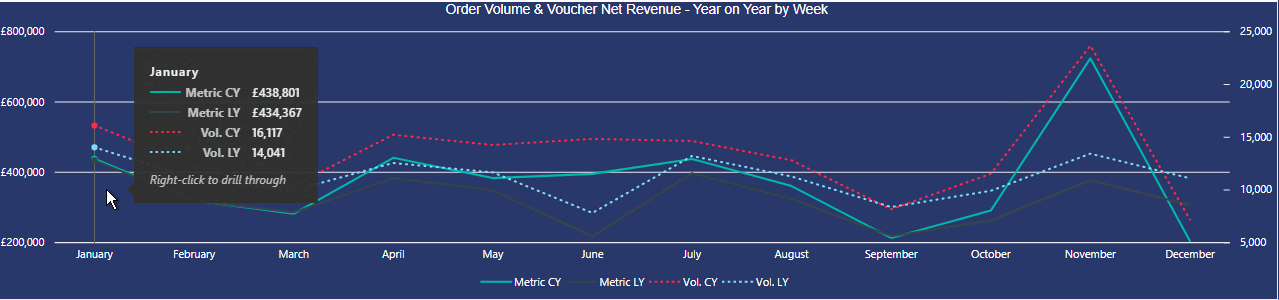
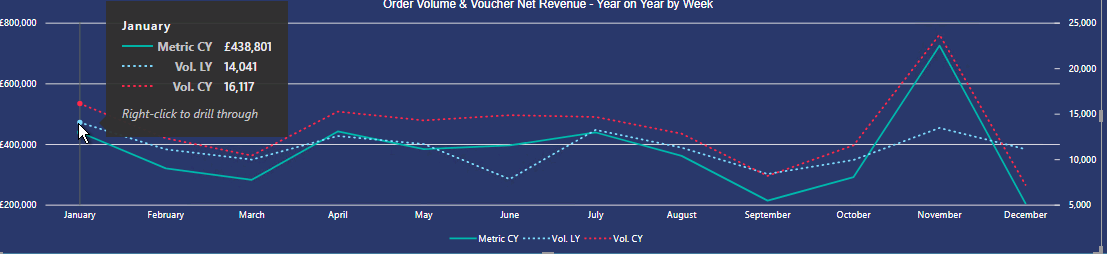
I am experiencing a similar issue right now. I have a Line Chart with 2 Primary Y values and 2 Secondary Y values and months as the X axis as per below:
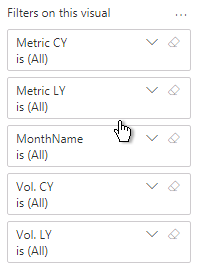
Oddly, the value seems to be present because it shows in the Filters section:
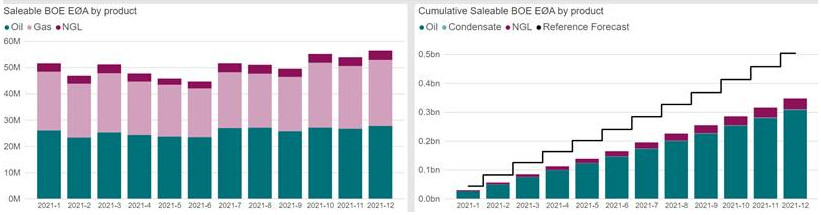
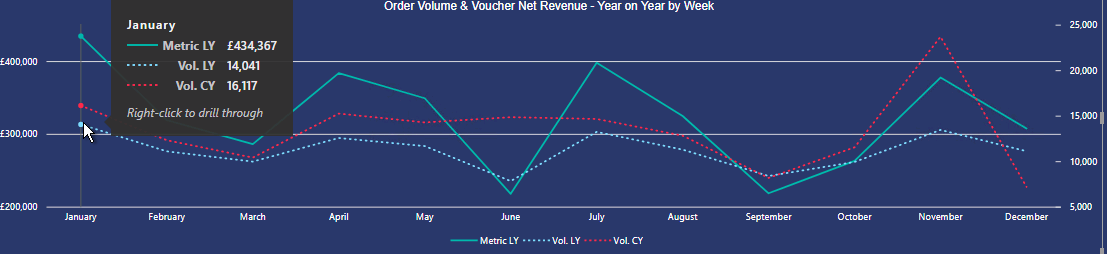
In addition, if I edit the Service version and delete the PY2 value then the missing PY1 line reappears on the chart - see the legend which displays Metric CY (Sales), Vol CY & Vol LY:
it did work before, it stopped working after 1 feb.
I made it work in a copy of a historic file
(I saved a copy from 21 jan, added a new page and made the visual from scratch, then I copied the visual from the old page, put it close to the new visual, and uploaded to the Service. To my surprise and confusion the new visual did capture all the measures, not the old one). Is it fluck/random? or sth was done to the file later than 21 jan? I dont know.
I did edit in Service too - I took the measures out of the visual and put them back in, and all (5) of them appeared in the visual (though this can be a temporary solution, it is not Best Practice)
I also made a copy of the visual and change it to Table, Ribbon, Line… visual and all measures appear in the service. I though memory might be a problem, but i dont think so…
I will keep trying.
I let you know if I find the reason or a solution.
Regards, i.
thank you very much for your responses, I appreciate you taking the time.
I posted the same enquiry above, to the Micorsoft Power BI forum yesterday afternoon and received a suggestion a few hours later that I have since tested successfully.
The issue, it appears, is with the Conditional Titles that I’d included with the report which uses a metric selection slicer to allow the user to select either Order Volume, Value or Margin.
I’d incorporated Conditional Titles to adjust their value based on the selected metric but when removed, as per the advice I’d received on the MS PBI forum, my missing measures magically reappeared on the affected charts.
The responder did also mention that installing the latest update also had a positive affect but I am already using the latest version so cannot confirm whether this is the case.
I hope this helps you and resolves the issue and please do let me know either way.
I upgraded yesterday the Desktop to decebmber2020 version. Did not make a difference.
I also have slicers and dynamic Titles/Headers (using switch). Deleting the headers did work to for some of the visuals, but not for all.
Hi @Irina, we’ve noticed that no response has been received from you since the 11th of February. We just want to check if you still need further help with this post? In case there won’t be any activity on it in the next few days, we’ll be tagging this post as Solved. If you have a follow question or concern related to this topic, please remove the Solution tag first by clicking the three dots beside Reply and then untick the checkbox. Thanks!
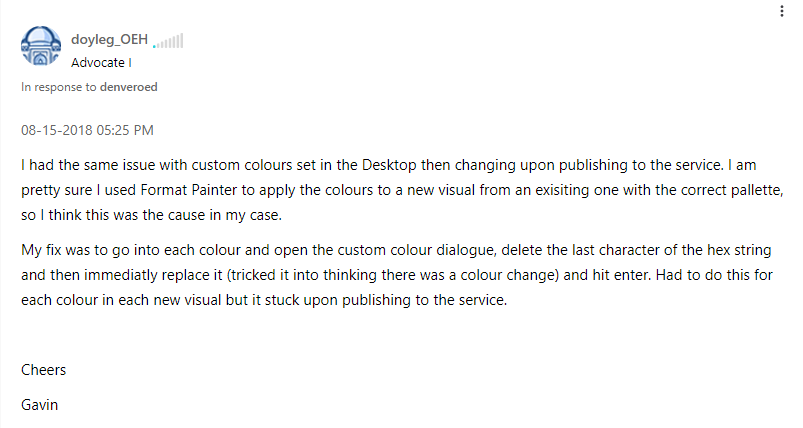
I did some research on this, and it’s a known bug within Power BI. Here’s a long community thread about it, and I screenshot the post that reflects the consensus opinion as to the best way to solve the problem. I hope this is helpful.
Hi Brian
Thank you for reply - appreciate your suggestion.
It helps to know that a bug maybe the reason. However, I am puzzeled by couple of things:
it did work perfectly for the last couple of months, it stopped working after 1 february
if it is a bug many experienced since 2017, why it is not fixed yet?
I found a temporary solution - by editing directly in the Power BI Service, but this is not Best Practice imo, and I dont want to do this going forward.
I continue investigating. keep you posted.
Regards, irina.
Hi @Irina, did the response provided by @BrianJ help you solve your query? If not, how far did you get and what kind of help you need further? If yes, kindly mark as solution the answer that solved your query. Thanks!
There has been no response has been received from you since the 10th of February.
We just want to check if you still need further help with this post? In case there won’t be any activity on it in the next few days, we’ll be tagging this post as Solved. Thanks!
Hi @Irina, a response on this post has been tagged as “Solution”. If you have a follow question or concern related to this topic, please remove the Solution tag first by clicking the three dots beside Reply and then untick the check box.
We’ve recently launched the Enterprise DNA Forum User Experience Survey, please feel free to answer it and give your insights on how we can further improve the Support forum. Thanks!