Visual Total not the Grand Total I'm expecting

The attached file is sample data.
I’m simply trying to calculate patients per day. The data given to me could be massaged in Excel to eliminate repeatable names but I don’t want to filter data for each monthly feed.

In the attache PBIX, the distinct count for each month is correct. But the visual, I believe is giving the total as a distinct count of patients last name across all months. I’d like to simply change the visual to Grand Total instead of what ever calculation is default.

Is that possible, and considering I’m a newbie, is there a right way to get the grand total for the patient counts?sample data.pbix (108.9 KB)

reviewing your data - I see there are 1,355 distinct last names, with a total of 15,811 rows.

if what you want is for the measure to return 107 for May 2018, but to return 15,811 for the Total, please see “Patient Count 2” measure in the attached file. Basically it forces the measure to provide a different type of total if there is not a filter on the Month & Year column. But I suspect that is going to cause confusion for anyone consuming this report.

Perhaps it would be clearer to just remove the total entirely. This can be done by turning the total off in the visual, or in the measure (see “Patient Count 3” for this example).

If you are trying to return the sum total of each month’s distinct counts (which would be 4,109) - I think that’s beyond my skill currently.

sample data 2.pbix (113.9 KB)

Thank you for your reply. I have thought of turning off the totals, the row totals being correct and grand total being incorrect. So just turn off the grand total.

However, I’d love to know how to make grand total simply sum the row totals and it properly summarizing the total patient count, alas it is beyond my current skill as well.

Technically the grand total is correctly showing the total “distinct” patient count (not the sum of totals for the row totals). But from a visual perspective it is incorrect, anyone looking at the numbers expects the grand total to be the sum of the numbers above and will assume the visual to be wrong when the sum is so obviously not representative of the row totals, hence why it has to be corrected or tuned off.

I admit, it took time for me to get used to this as well, but you will find this is how measures work, the total line basically removes the row filters and returns the calculation for the entire dataset (as defined by your filters).

It does require a bit of mental shift to understand, but my report consumers and I have both come to prefer this perspective as it is more correct. After all, just because a patient appears in a clinic on April 1st after also showing up on March 31st, they are not technically a new person.
Many of my reports include a small tutorial demonstrating what is going on in the total row, to prevent confusion and educate new users.

As you have said, the Total row is correct, and perhaps renaming the column to Distinct Patient Count would better help folks to understand how the total is actually working.

Good luck with your report - I hope you find a solution that works for you and your report consumers.

@Surfingjoe
What would you ideally like to see in the Grand Total row? Would it be 4109?

Enterprise%20DNA%20Expert%20-%20Small

Nick, Yes that would be total I’m expecting.
The reason I’m using “distinct” is because the source data doesn’t use a Quantity column. If a drug is dispensed in three vials then I will see 3 rows of the same data for that same patient.

Basically, we want to know how many patients per day. Have to use distinct count of patients per day because of repetitive rows for the same patient. Need to summarize Patient counts by month (and yes a patient is seen more than once in a month). And then see the totals per month and the grand total summarize patients per month.

On top of that, I need to show how many patients per location by month and distribution of patients by other categories not found in the sample data.

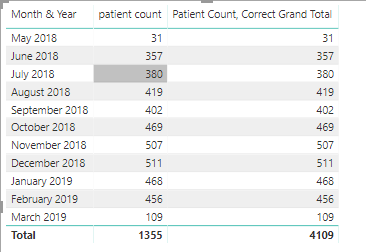
That makes sense. In order to get the total you want you need to change the filter context. So for each row (month and year in this case) the filter context is just that month and year and then you get a distinct count of patients in that specific month and year. When you look at the grand total it is taking all of the month and years and giving you the distinct count of patients using that context. Which is why you see 1355 since a patient can only be counted once in that context.

So what we do is change that (well every ) fitler context to take the Values of the Month year as the table for SUMX to iterate and using the [patient count] measure previously created. In the first row, May 2018 is the only value that will be iterated, so SUMX will iterate that table and return the sum of patient count. Since it’s just the one value we only get the patient count in that month year.

Now looking at the grand total, the values of year & month is all the year months. SUMX will iterate that table. It will start at May 2018, iterate over that and calculate the patient count for that month. Then it will continue on for each month and year and at the end it will take all the individual year month totals and sum them up. So what looks like the grand total is just the sum of above, is really something a little different. Everything happens in context ( filter and row ) . Also in the measure below you have either use a measure already created, or wrap it in CALCULATE as you need to invoke context transition.

Patient Count, Correct Grand Total = 
SUMX( 
     VALUES( Source[Month & Year] ), [patient count] )

matrix

If you put Location and Year Month on Rows (with the same measure from above) you get this:

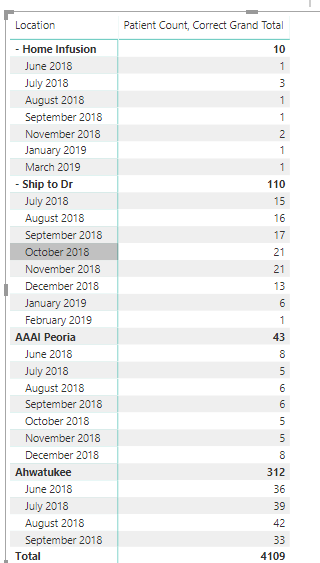
Not sure if that is what you had in mind…

I do not follow

distribution of patients by other categories not found in the sample data.

Can you post a mock-up of what you would like?

Enterprise%20DNA%20Expert%20-%20Small

1 Like

Apparently I need more caffeine before answering questions on the forum… :coffee:

I can identify with this sentiment. Just when you’re on a roll someone takes thing s in a different direction, makes you want to doubt your abilities.

Enterprise%20DNA%20Expert%20-%20Small

1 Like

I change the formula to per source[Date] because distinct count per month might count a patient visiting more than once in a month. Other than that, your solution works across the board.

I tried using values erroneously previously and certainly more complicated formulas, but your sumx of the values works great.

thank you

Great. Glad you were able to find your answer.

Enterprise%20DNA%20Expert%20-%20Small