Just a quick question and I hope this is the right title. I need to create a graph that will change from Revenue, Margin, and Cost of Sales by selecting the corresponding filter.
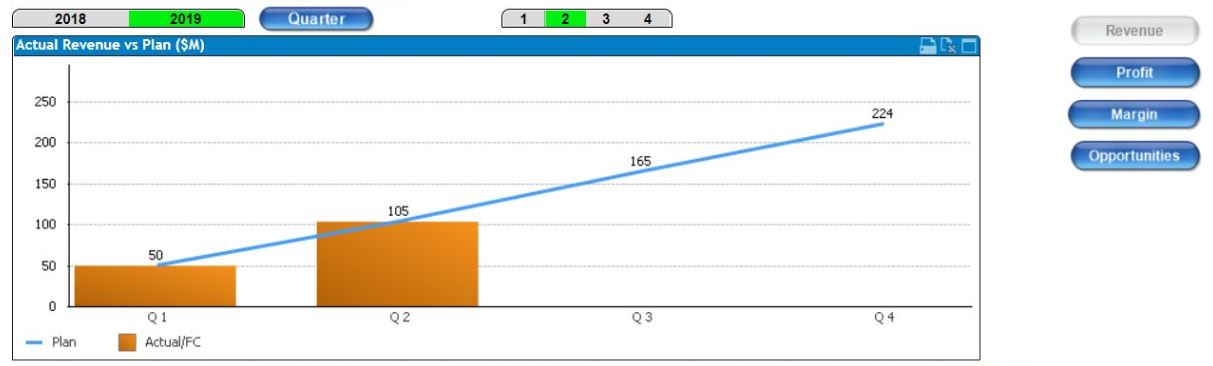
In the end, I have one chart that is comparing Revenue vs Budgeted Revenue when the “Revenue” slicer is selected, but changes to Margin vs Budgeted Margin when the “Margin” slicer is selected…
I remember seeing a video on this but I can’t find it. Could someone link me to the correct video on how to set this up.
Thank you!