Using measures for Date column rather than Index col for row context

Dear Friends

I have enclosed two files: Data and Test (PBi file). Data file has input fields and desired output.

Challenge: The dates are not in sequence and there are also product categories. Hence, the calculation done to compute the row differences has been done by me using an index col and by introducing columns rather than a measure.

Request: Need help in developing a measures cal for calculating “Value1” and “EMA”.

I have developed both column calculations and one measures cal but it does not address a dynamic scenario

Will request your helping using “Time intelligence calculations” using previousday(), dateadd etc

Thanks in advance

Regards
J

test.zip (74.2 KB)

Jarvis,

Welcome to the forum. This is a perfect example of why a “Date Table” is needed. In order to do correct Time Intelligence measures you will need a date Table. Sam has lots of great content on how to setup a proper Date Table. I have also added a document with some M code that you will need once you view his video. Let me know If you need any other guidance once you have reviewed this material.

Power BI Date Table Code with Offsets - 4-6-2020.txt (5.8 KB)

http://portal.enterprisedna.co/courses/mastering-dax-calculations/lectures/2000648

Thanks
Jarrett

Hi Jarrett

Appreciate your prompt reply. In my main datamodel i have used the date table. I have enclosed a revised file after incorporating the date table.

Request if the file can be reviewed along with the desired results and help me out.

If you notice, “Diff_col_method2” col is capturing values on dates that are not in the original date table.

Please help with where iam going wrong

Regards
J

test (2).zip (175.6 KB)

Jarvis,

Why do you need the “Diff-col-method2” calculated column? Looks like your other calculated column using the index is giving you the correct answer when compared to your Excel Sheet. Need to be much clearer of what you want to accomplish, and if you know the given correct result, share that as well.

Thanks
Jarrett

Jarvis,

I think I have come up with a solution using what you have provided. I have attached the PBIX with my changes. Here is a snapshot of what it looks like:

image

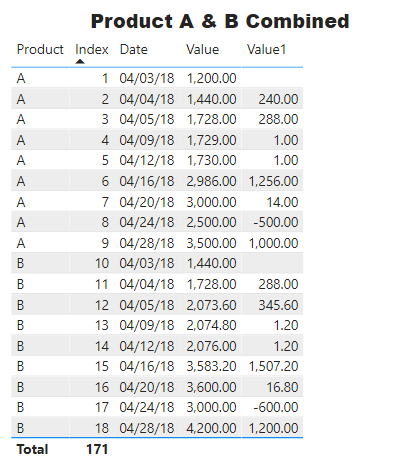
EDNA Forum- test 2020 v2.pbix (183.7 KB)

Thanks
Jarrett

Dear Jarrett

I really appreciate your response. I replicated the measure in the main data table. Iam getting a blank column.

I therefore researched a bit more and introduced two columns in the Date table for workdate and workday. However, iam not able to solve the problem.

I therefore request your help to review the Powerbi file and help me replicate the working in the excel file ‘data’ for col value 1 and value 2.

The objective of introducing work day was to replicate the concepts of “Weekday” in this working.
: Ref: https://www.youtube.com/watch?v=2umfdZElvDU

If i manage to add a date field using the workday column then i can use concepts such as PreviousDay etc. However, iam not able to do this and need help

Value 2 : replicates the EMA calculation done in the below link

I would really appreciate your help

Regards
JTest1.zip (1.6 MB)

Jarvis,

I’ll have a look into this, but probably won’t be until after the holiday weekend. In the mean time, have a look at this resource pack from Sam on a Stock Market Dashboard. I’m sure you can follow the logic in this resource and come up with a solution. Let me know what you come up with.

Thanks
Jarrett

Jarvis,

Here is a quick model that I put together with your data that resembles Sam’s model. Let me know what you think.

EDNA Stock Market Solution.pbix (737.7 KB)

Thanks
Jarrett

Dear Jarett

I want to thank you to take efforts and help me with the dashboard. I have analysed it and have few questions /clarifications:
a) Weekday calculation: In the data set i have given, the dates where the prices are appearing are for days lesser than the weekday. Hence i have introduced a column - “Closing price date” in the Date table. Hope this logic is correct. There are approx 31 days variations between ‘is Week day’ col and ‘closing price date’ col
b) The calculation of 30MA and 90 MA is on the basis of calendar month period not exact days. Hence i have introduced a col (N_Key) in closing prices table and working ‘mov30days’ and ‘mov7days’ which is based on Numerator /Denominator (distinct count) calculation. Is there a way we can correct 30MA and 90MA to introduce the exact days rather than calendar days. In page 2 dashboard, i have given the comparison of the two calculations.
c) Closing price for given date: All the calculations given in the dashboard are based on ‘Last pricing date’. This is good. However, some advanced calculations that i wish to carry out requires subtracting one row to the other as given ‘Value1’ col and ‘EMA’ col of the data file. This will require using ‘Previous day’ formula etc. Currently previous day is taking ‘last price’ not price on the date of calculation.Can Time intelligence be applied like the way ‘Last pricing date’ has been calculated. If you can help solve this, it would solve a major problem for me.
d) 30dayago price, 7 dayago price etc: Page2: why are the same values appearing on all the rows. I think if we solve ‘c’ above, we can solve ‘d’
e) lastly: in “Stock price” measure, “Codes[Stock Codes] =” has no implication and consequence as it is anyway for filtered info. Please confirm.

Thanks in advance.

Regards
Jtest2.zip (741.2 KB)

Jarvis,

Here are some answers to your previous questions:

A: The Weekday calculation only includes days from Monday-Friday I looked through the data and all of the dates where there is closing prices and volume data are all on Weekedays. This is why I marked this calculation as TRUE as a filter on the page so that only data will show that is on a Weekday. There really is much of a need for you new column you added. I you wish to add it, you would need to apply the same logic as I did in the Pricing Data Exists column.

B: You are correct that the measure calculation of the moving averages is by calendar month, but when you apply the Weekday is TRUE as a filter on this page, it will calculate those averages based only on Weekdays. I also have the Pricing Data Exists column as a page filter as well.

C: I will need to work on solving this issue, because it doesn’t currently work the way you want it to.

D: The 30 Days Ago & 7 Days Ago Measures are showing same numbers because it is going off the MAX Date in the date range on the page. You are correct in thinking that once we solve C, D can be answered with similar logic.
E: The way this is currently designed you would still want whatever Stock you want to be the default if it is not filtered, just in case there ever is a situation where it might not be filtered. Don’t get hung up on this one, leave it as is.

** I will start to work on answers for C & D **

Thanks
Jarrett

Jarvis,

Here is what I have completed so far. I figured out Value 1, 7 Days Ago & 30 Days Ago Measures. Still working on getting the 30 & 90 Moving Averages. I put each of those measures in the Closing Prices table.
I got a bit creative on adding the Index column. I saw a similar post to this that @Nick_M came up with this solution. If you go into the M code you will se how I grouped the Index number by stock symbol.

EDNA- Solution Except Moving Averages.pbix (721.2 KB)

Thanks
Jarrett

Hi Jarett

Thank you very much for your support.

In the link below, the working on EMA has been solved.

Request your help you solve this last leg. Looking forward to your solution to help us calculating the Moving average and EMA. The outcome similar to EMA in the last col of the enclosed sheet.

Regards
Jdata.xlsx (11.3 KB)

Jarvis,

Let me know if this is what you are looking for with the 7, 30 & 90 Day Moving Averages before I move on to tackle the EMA.
EDNA- Solution Except EMA.pbix (721.7 KB)

Thanks
Jarrett

@Jarvis, a response on this post has been tagged as “Solution”. If you have a follow question or concern related to this topic, please remove the Solution tag first by clicking the three dots beside Reply and then untick the check box. Thanks!

Hi Jarett

Iam very much comfortable with the entire calculation. There is only one element that i could not perhaps find in the solution which is “Calculation of EMA”. That was the last col in my excel sheet model.

I did try using the last PowerBI output with the below measures:
prevday30MA =
CALCULATE(
‘Moving Averages’[mov30days JRM],
PREVIOUSDAY(Dates[Date]))

EMA =
(0.0006*(‘Moving Averages’[mov30days JRM]-prevday30MA)) + [prevday30MA]

Iam not getting the output for the above. Question: Would the previous day formula above take the right date i.e filtered on the exact dates for which the prices area available.

With the above calculations in the model my solution would be complete.

Really appreciate your help. Thanks

Jarvis,

II don’t believe that you can use PREVIOUSDAY that way you have things setup in your model, especially when there is not data for every day. I will have another go at this on Monday (Located in the U.S.).

Thanks
Jarrett

Hi Jarett

I have manage to solve one part of the problem on previous day averages in column mdata1.

Despite fair degree of research put in by me, couldnt solve the “Loop” problem in calculating “EMA” column in the excel sheet. EMA takes value from the preceding cell. The first row is the average of x no of days, rest are computed using the same column and previous value. So a circular ref is getting formed

That is the only part left.

Found few links that have solved this before:

Appreciate your help

EDNA- Solution Except EMA_j.zip (720.8 KB) data.xlsx (11.3 KB)

Jarvis,

This is the closest I can get to coming up with a solution with the information you have provided. Let me know if this works for you. If not, you need to provide an Excel sheet with the data that is in the model with the expected result. Here is the link that I tried to get as close as I could to replicating how they solved the EMA:

EDNA- Solution with EMA.pbix (722.9 KB)

Thanks
Jarrett

1 Like

Thank you very much Jarett for your help. This solution works.

1 Like