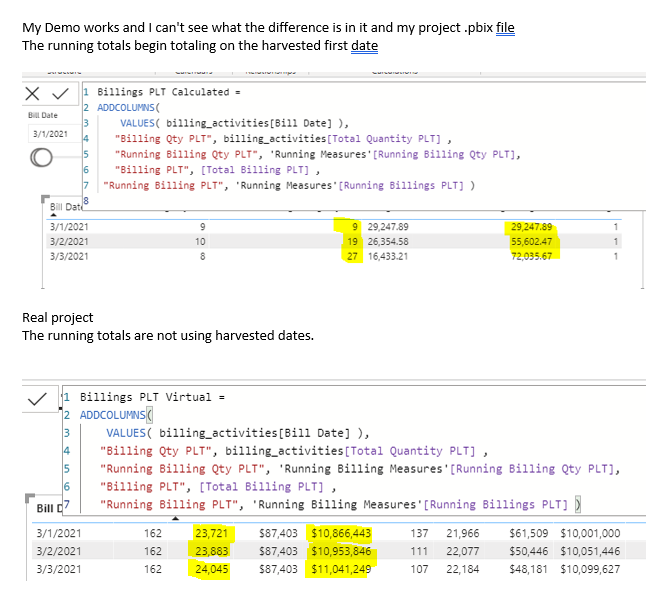
I have a running total error. I could not duplicate the error in my Demo file. It works.
The measures are identical to my real project. But in my real project the running totals are not starting on the harvested date and for the world of me I cannot see what the difference is.
My model has not changed since I learned the technique of using the harvested dates and a within range filter. I am using it in both.
What might be causing the running total to have context other than the harvested dates?
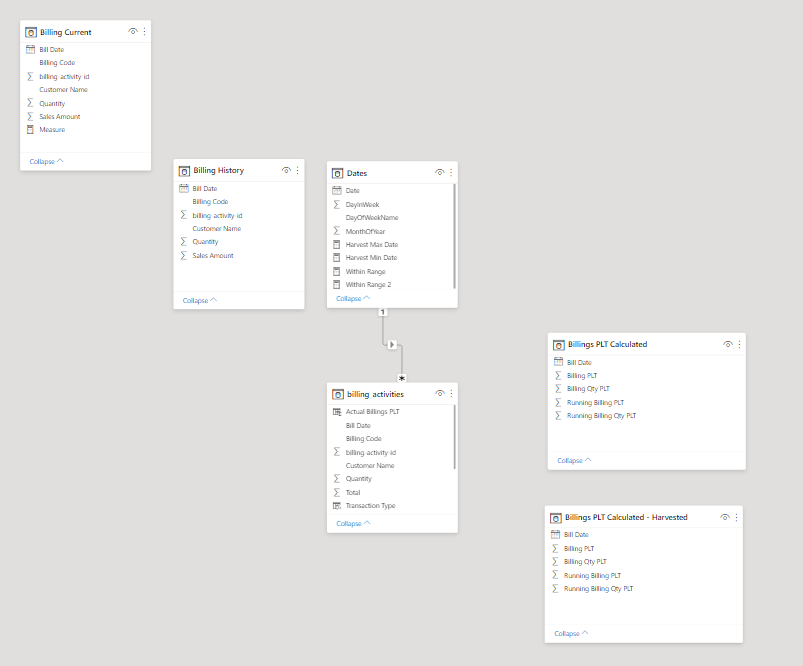
Without the other file to compare to, I can’t say for certain what the issue is, but looking at it I think it’s related to the fact that the demo is using DAX calculated tables while the real project is using virtual tables. I did a video focused on the differences between table types in Power Bi a couple of weeks ago that you may find helpful in unraveling the difference between the behavior of these two reports.
If that alone doesn’t solve the mystery, perhaps you can mask the second file and provide it for comparison?
You were able to lead me to that video earlier in the week for another topic. I renamed the calculated table correctly in the demo: ) . I didn’t what to change the name of the calculated table in the real project. So the calculated table is the same in both files. I will work on masking what I am seeing. Thanks.
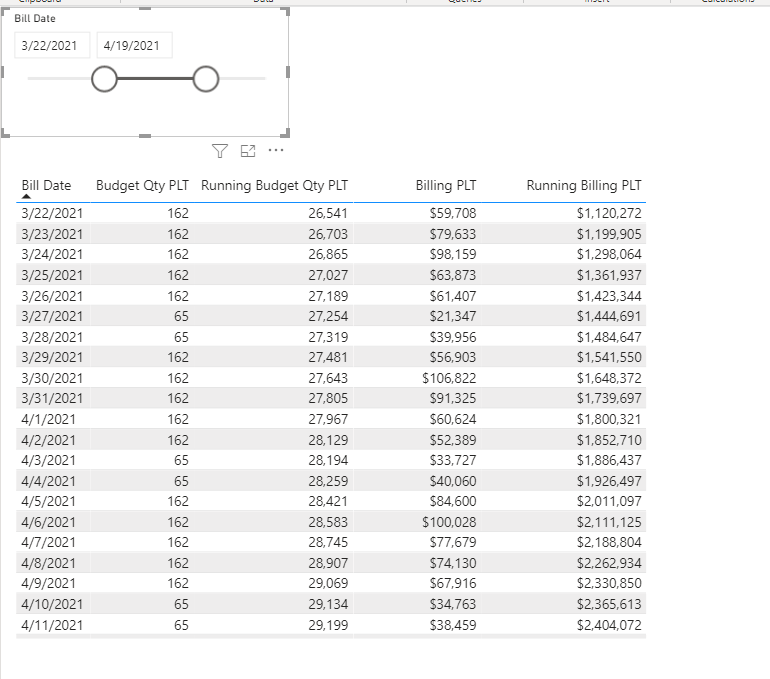
Curiously, I’ve found the solution. Those columns were accumulating since the beginning of the date range (date table 2020-09-01) to to the minimum harvested value and continued accumulating accordingly, daily.
When I created a new measure by wrapping a sum around the Running Billing measures, somehow the context went back to the beginning of the harvested data in the calculated table. It forced it to iterate thru the date and use the daily data values.
No relationship between the date table and the fact table, plus an improper 1:1 relationship between the DAX calculated tables.
I strongly suspect the guiltiest party here is the horrendous “Auto Detect Relationships” option, which likely created the 1:1 relationship automatically. Literally, the first thing I do when creating a new Power BI report is to go in and turn that option off. Unfortunately there’s no way to do it permanently and globally, you have to do it individually each file you create.
If you delete the relationships in the second file and re-create them properly ala the first file, everything should work as expected.
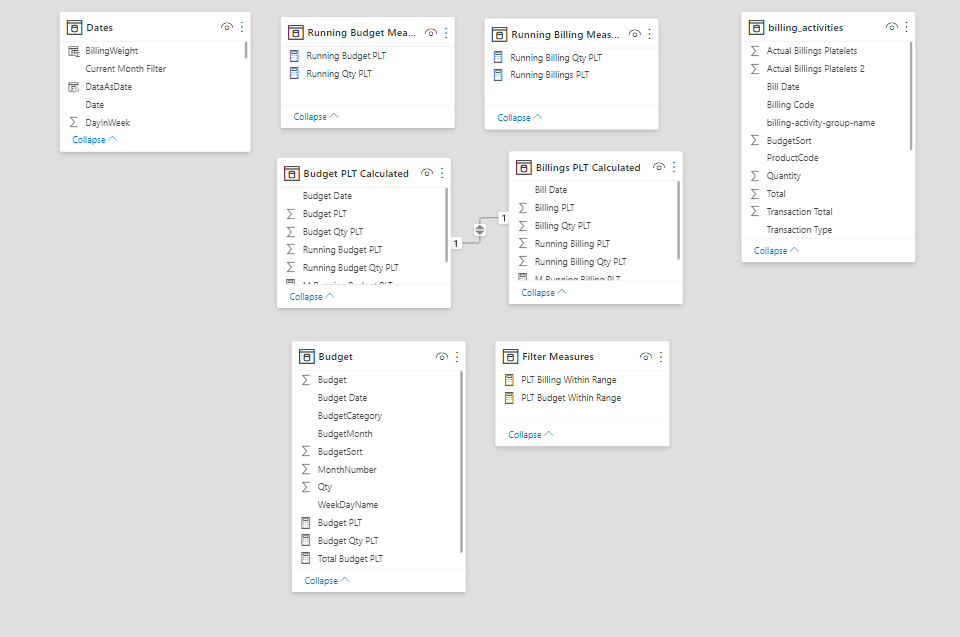
Hi Brian. Still not working as expected. I have to have the relationship between the two calculated tables. In the real solution, I have several products, this just shows 1 one of them for the demo. It’s a huge project with several products and well over 100 measures and it took quite a bit to take everything out of it to show an example for 1, masked. The project compares budget to actual billing.
The running calculations in the real project worked until I added the date slicers.
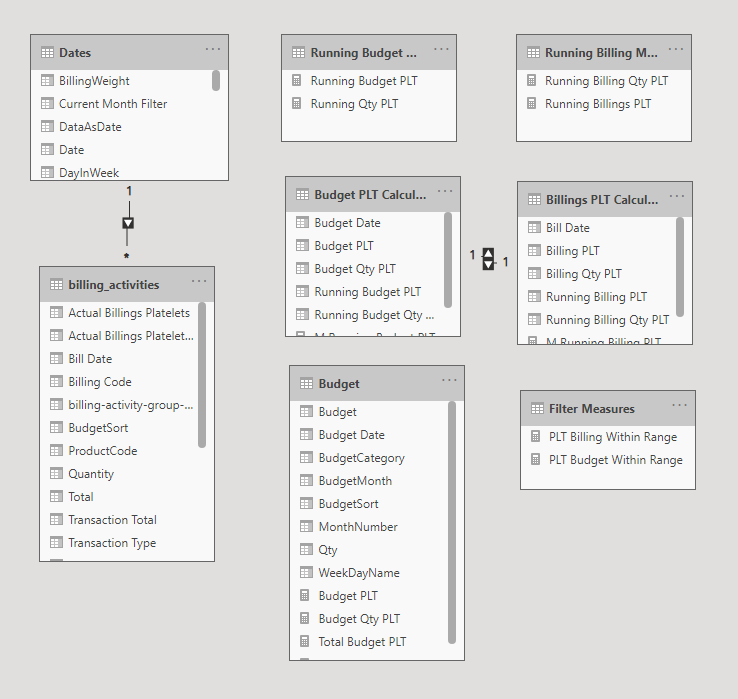
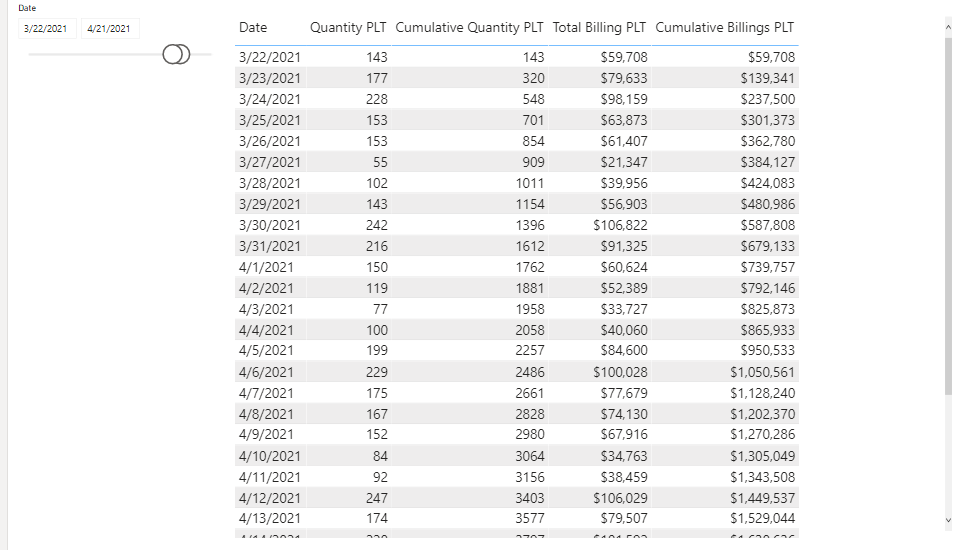
Please take a look, but I think I’ve got DEMO2 working properly. I have simplified the whole thing dramatically – your original model was a mix of physical tables and calculated tables, and explicit and implicit measures. I don’t think the calculated tables are needed (at least for this visual) and in general you should avoid use of implicit measures entirely.
I connected the date table to the billing activities table via date/billing date, marked the date table as a date table (key for time intelligence functions to work properly) and then simplified your cumulative measures to this form:
You did it, thanks so much!! This will really simplify my model. If it wasn’t so late and I hadn’t worked into wee hours I’d start using this approach for the rest of the categories. Tomorrow is soon enough.
Perhaps I will get better performance too. It does not seem like 250K rows should take so time to load. For every table, that has measures, are they being calculated for every row during the load?
Great – glad to hear that got you what you needed. Yes, getting rid of the unnecessary calculated tables should speed your performance substantially. Measures are only calculated when and within the context in which they are called, whereas calculated columns/tables are calculated fully row by row on every load and refresh. Therefore you have a total of 10 columns x 250,000 rows calculating unnecessarily each time.
Good luck with the full revisions, and just give a shout if you run into any other unsolved mysteries.