Tracking a base of customers % of total activity over time

Hello, I am trying to perform some analysis that reminded me of the previous EDNA churn example (looking whether a current customer previously ordered within a 90 day timeframe). However, my more specific issue is:

I want to see if what % of customers taken from a snap shot date (let say most recent date in dataset), ordered in the last 7days and what % of all customer activity were those customers.

Example.

On 8/31 - I had 4,037 customer orders, priod days as follows:

image

what Dax formula can I write to group customers just from 8/31 and evaluate them in the context of ordering or not in the prior days?

Please advise,

Thanks.

Hi @Swhs24,

I would have been amazing if you would send us some sample file to work on. However, I have created a sample data for you to work and using mentioned technique, once you get new customer list, you can do different calculations etc.

Sample Data:

image

You can see that ID=3 is new customer on 10th of January, so our measure is bringing only that customer. Sample file is attached. as well.EDNA_Finding New Customer.pbix (35.1 KB)

EDNA Orders.xlsx (3.1 MB) EDNA PBIX File.pbix (1.7 MB) I apologize for not including data, this go round I have included both an .xlsx and .pbix file for reference.

Please note, I made an attempt at replicating the formulas you advised and I believe due to the “countrows” technique I getting large multiples for results that put me further away from the desired result:
image

I did a manual method the indicates the desired result but it’s not scalable which is why I’m trying to find a formulaic method:
image

here’s a sample view of the desired result:
image

EDNA Orders.xlsx (3.1 MB)

Hi @Swhs24,

Thank you for sending me your sample file. I think your sample PBIX and excel had a little different data. However, Please find below my analysis:
If you see in below snapshot, on 24th of August all customers are treated as new customer because it was first date in our context and numbers were same(4053)
image

However, on 25th of August, we had 1170 New customer and it is evident when I query it using DAX studio.

Please find attached file and let me know in case of any issue.EDNA PBIX_New Customers File.pbix (1.7 MB)

This is helpful but it doesn’t quite capture the logic I’m after. I tried to modify your formula in an effort to see if I could leverage it and I failed.

Once again, the initial request is can I somehow use the customer list from those that ordered on 8/31 and then look back in time (7 days) to evaluate what percent of the total ordering population did those customer that ordered on the 31st contribute.

Your existing setup looks at it in reverse, starting on the 24th and then looking ahead 7 days how many customers from the 24th were ordering as a % of total subsequently.

What would be really helpful is if you could help me understand how I can pick list of customers from any anchor date (ie 24th customer list or the 31st).

Thanks,

-Steven

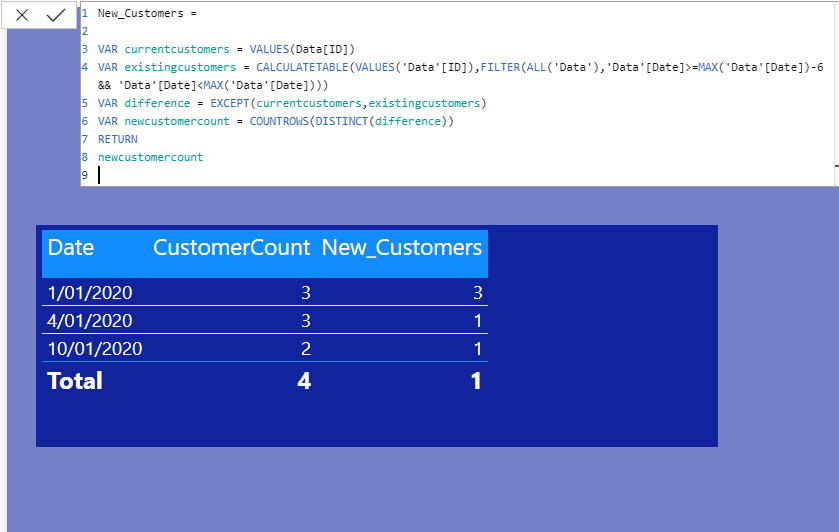
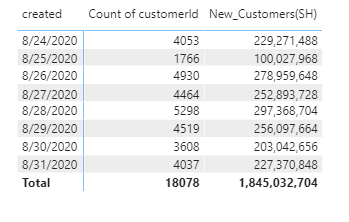
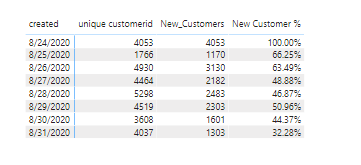
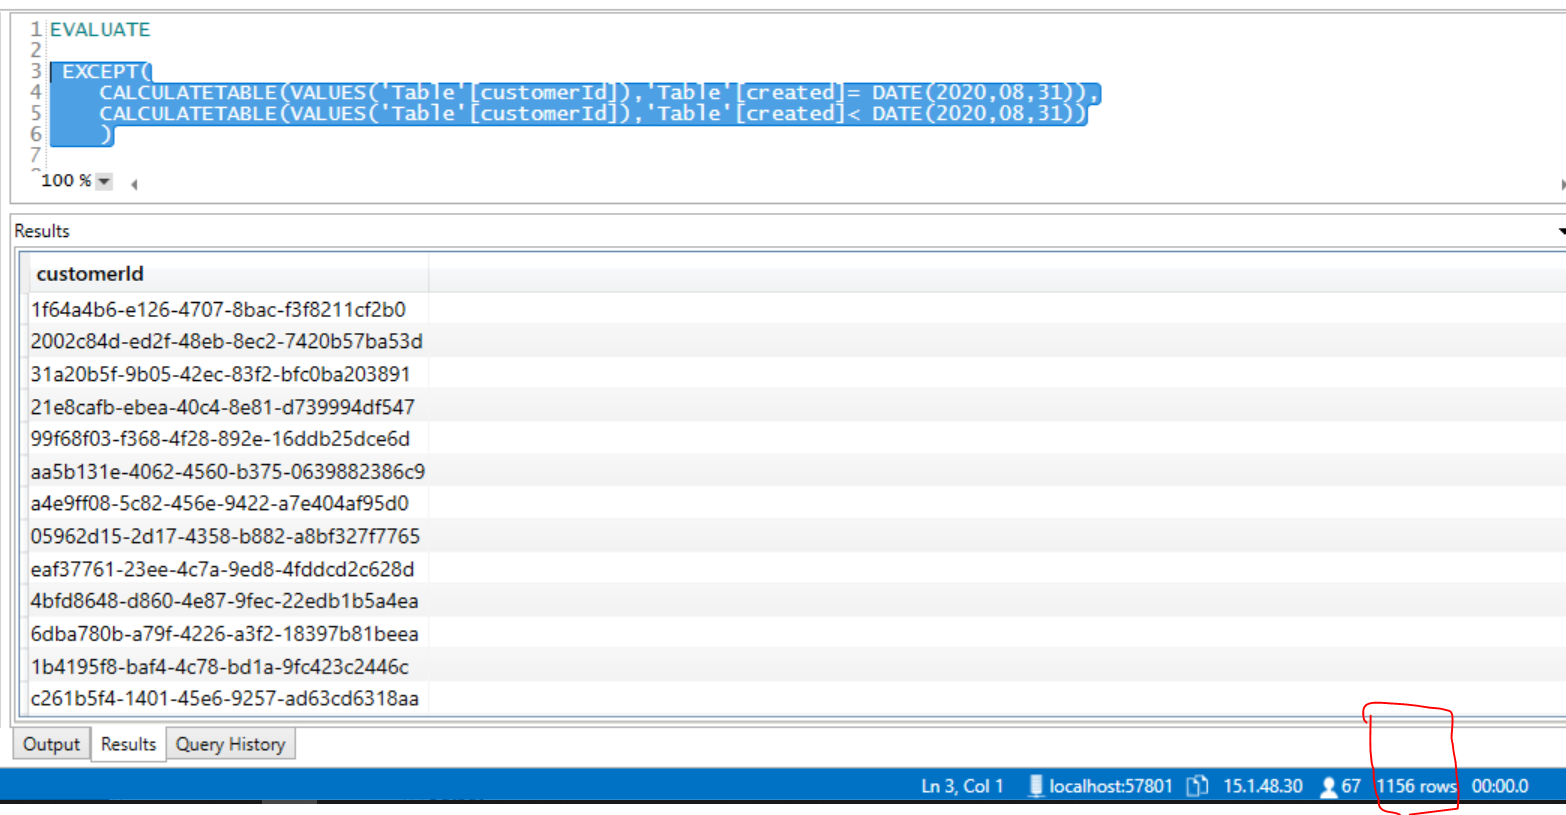
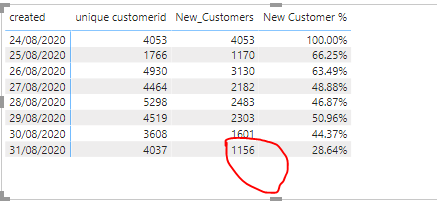
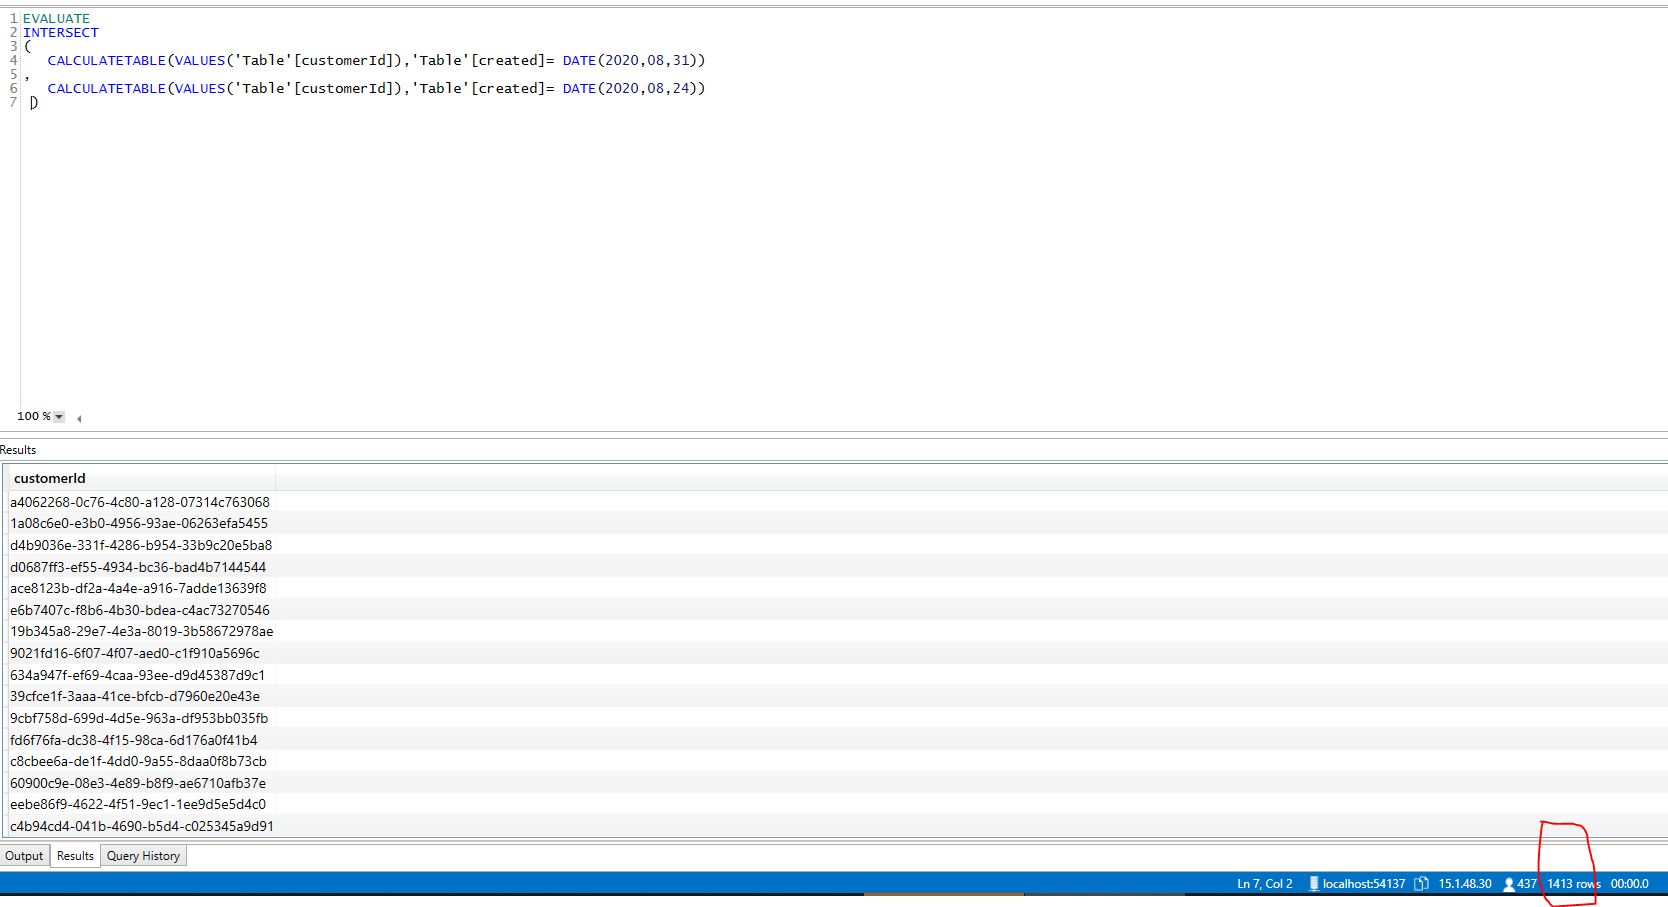
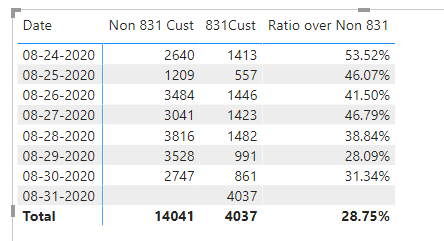
I don’t know how you got these numbers based on your request of looking into past, but if that is what you want here is the solution.
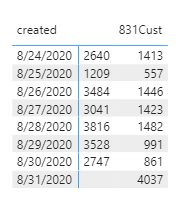
831Cust = 
CALCULATE (
    DISTINCTCOUNT ( 'Table'[customerId] ),
    KEEPFILTERS ( '831 Customers'[Group Flag] = "831Cust" )
)

.

Non 831 Cust = 
CALCULATE (
    DISTINCTCOUNT ( 'Table'[customerId] ),
    KEEPFILTERS ( '831 Customers'[Group Flag] <> "831Cust" )
)

.

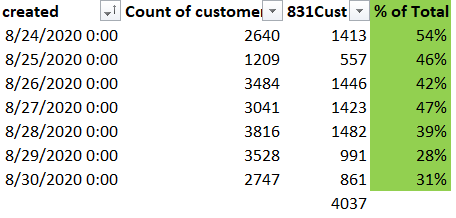
Ratio over Non 831 = 
DIVIDE (
    [831Cust],
    [Non 831 Cust]
) 

image

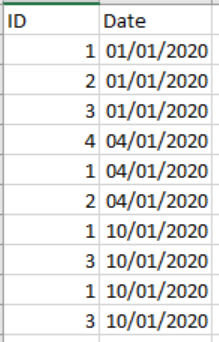
You need to work on your data model, those Store, Customer, and id are not readable at all, replace them with integers so that it is easier to verify the results. I can’t tell which customer to check for. And why keep those 11 blank columns?

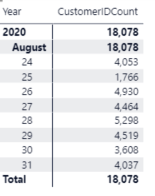
I have used the below date table to show result based on date from dates table.

Dates = 
VAR MinDate = YEAR ( MIN ( 'Table'[created] ) ) 
VAR MaxDate = YEAR ( MAX ( 'Table'[created] ) )
VAR CalendarStartDate = DATE ( MinDate, 1, 1 )
VAR CalendarEndDate = DATE ( MaxDate, 12, 31 )
VAR DateList = CALENDAR ( CalendarStartDate, CalendarEndDate )
VAR Result =
    GENERATE (
        DateList,
        VAR CurrentDate = [Date]
        RETURN
            ROW (
                "MonthNumber", MONTH ( CurrentDate ),
                "Month Name", FORMAT ( CurrentDate, "MMMM" ),
                "Year", YEAR ( CurrentDate ),
                "Year Month", FORMAT ( CurrentDate, "YYYY MM" ),
                "Quarter", FORMAT ( CurrentDate, "\QQ" )
            )
    )
RETURN
    Result

EDNA PBIX File (1).pbix (1.7 MB)

Yes, the reason the Store, Customer, and other ID fields are not readable is because they are an extract from a database with millions of records and that’s the only method we have to establish unique IDs. That said for the purpose of this exercise (using sample data) I can revise if it helps.

As for your solution, I cannot use any dax formulas based on upon the “manual method” (IE 831cust OR Group Flag or other). I just did that manually in excel and reuploaded to PBIX file to show what I was reaching for as an example. That was a manual download of all customerIDs ordering on 8/31 and comparing this list, via PowerBI, to every customerID in all the previous days. As I said that doesn’t scale which is why I’m looking for help with a dax formula on the “Table” data (NOT the 831 Customers data-that was my example only)

Hi @Swhs24,

If I understand completely, lets say a customer has ordered on 31st, you want to see if that customer has ordered in past 7 days. If he/she did not order in past 7 days, then he/she is new customer. Now, I explain my logic. If I count number of customer on 31st and all customers appear before 31st, I get 1156 records. So, these 1156 are NEW customers as they did not appear before that.

Now, if you see my calculations, on 31st of August, new customers are 1156.

image

Below is the formula:

New_Customers =
VAR currentcustomers =
    VALUES ( 'Table'[customerId] ) // Get current list of customers.
VAR existingcustomers =
    CALCULATETABLE (
        VALUES ( 'Table'[customerId] ),
        FILTER (
            ALL ( 'Table' ),
            'Table'[created]
                >= MAX ( 'Table'[created] ) - 7
                && 'Table'[created] < MAX ( 'Table'[created] )
        )
    ) // Get customers who appeared in last 7 days.
VAR difference =
    EXCEPT ( currentcustomers, existingcustomers ) // Subtract all customer who appeared in last 7 days from current list
VAR newcustomercount =
    COUNTROWS ( DISTINCT ( difference ) ) // count customers.
RETURN
    newcustomercount

Please try to use this formula as a Measure and show me the results that you were expecting on 31st? Please find attached PBIX file.EDNA PBIX_New Customers File.pbix (1.7 MB)

Hi @Swhs24, did the response provided by the contributors help you solve your query? If not, how far did you get, and what kind of help you need further? If yes, kindly mark the thread as solved. Thanks!

“If I understand completely, let’s say a customer has ordered on 31st, you want to see if that customer has ordered in past 7 days.” - 100% true.

"If he/she did not order in past 7 days, then he/she is new customer. " - This statement is not necessarily true. The distinction I am looking to make is NOT new or existing (that’s another analysis that may be valuable but not meaningful for this request). What I am looking to distinguish is, are the users that ordered on 8/31 the same users in all previous seven days? if not, what % of activity is contributed by users from 8/31 on each of those past seven days.

“If I count number of customer on 31st and all customers appear before 31st, I get 1156 records. So, these 1156 are NEW customers as they did not appear before that.” - This is confusing to me because regardless if a customer order or not on 8/31 they existing in the data which means they are an existing customer. The only way I could interpret that 1156 count is as the number of customers who ordered on any of the days prior to 8/31 but not in the 8/31 ordering group.

What also confuses me, per your screenshot, is even though we agree that there are 4,037 customers ordering on 8/31, your “new customer %” field reports 100% on 8/24/20 - does that mean that 0 customers from the 8/31 list ordered on that date?

Is the count of “new_customers” per your labeling, representing only those customers that are not on the 8/31 list for each day reported (8/24-8/30)?

Lastly, regarding count rows, if a customer orders more than once, does this formula count that customer distinctly? because I know you can count a distint value, I didn’t know you could count a distinct row.

I hope I’m not creating confusion. Just seeking to understand.

HI @Swhs24,

My applogies as I did not understand your question properly. I tried to put statement to show what each measure is doing.

Now lets analyze numbers on 31st of August(Last row):

In total we have 4037 unique customers. Out of which 1156(did not appear in any of last 7 days) and 2881(had some activity in last 7 days). When you total those you will get 4037.

1156+2881 = 4037

Now lets analyze numbers on 24th:
We do not have any records on previous date, so it can’t compare with previous days, so measure brings all numbers as these do not exist in previous days.

Does that make sense. All these numbers are unique customers. Please find attached PBIX file and let me know in case of any doubts.

EDNA PBIX_New Customers File V2.pbix (1.7 MB)

Regards

This is fantastic and very helpful but just missing one element. If I am interpreting the two columns: % with no previous record and % with Previous 7 day record, these formulas evaluate the current row context (aka the number of unique customerids) for their historical activity whereas I am looking for JUST the 8/31 group on EACH DAY.

Thus, of the 2881 customers that ordered on 8/31 and existed in one of the prior 7 days, how much of the total did customers from that group contribute on each of those days?

What you currently have is a rolling look backwards for each group of customers ordering on that day.

The key analysis objective: Imagine we had a reference list of customers. The entire group of customers on this separate list were known to have ordered on 8/31.

  1. How many of them ordered previously (per your data 2881 which is 71% of that entire 8/31 group)

  2. How many of the 2881 ordered on: 30/08/2020 (I don’t know, looking for the formula to provide an answer) and the next day and so on.

Hi @Swhs24,

Good explanation indeed and luckily we are heading in the right direction :slight_smile:

I have tried to do exactly what you wanted now as per you last explanation, but in case you still feel something is missing, please feel free to get in touch.

Now, if you see above, there are 1413 common customers who purchased on 31st and 24th of August. This can be verified using DAX studio.

So, now we can get percentage by dividing (24th count) 1413 to total on 31st(4037) to get result. Total on last row will be percentage from last 7 days(2881) to the total customers on that day(4037).

Its a little bit confusing but I have tried to include explanation in the dax formula.

customers purchased within 7 days =
VAR currentDate =
    CALCULATETABLE ( LASTDATE ( 'Table'[created] ), ALL ( 'Table' ) ) // Get last date in the table.
VAR add7days =
    DATEADD ( LASTDATE ( 'Table'[created] ), +7, DAY ) // Add 7 days in last date of current filter context
VAR getdate =
    IF ( ISBLANK ( add7days ), currentDate, add7days ) // if date is blank after adding 7 days, then we will get final date in the table.
VAR customeronlastdate =
    CALCULATE ( DISTINCTCOUNT ( 'Table'[customerId] ), 'Table'[created] = getdate )
VAR listofcustomersonlastdate =
    CALCULATETABLE ( VALUES ( 'Table'[customerId] ), 'Table'[created] = getdate )
VAR currentlistofcustomers =
    VALUES ( 'Table'[customerId] )
VAR commoncustomers =
    INTERSECT ( listofcustomersonlastdate, currentlistofcustomers )
VAR countofcommoncustomers =
    COUNTROWS ( commoncustomers )
RETURN
    IF (
        LASTDATE ( 'Table'[created] ) = getdate,
        [Count of Customer(Exist in last 7 days)],
        countofcommoncustomers
    )

Please find attached pbix file.

EDNA PBIX_New Customers File V3.pbix (1.7 MB)

1 Like

This is it…thanks!!!

1 Like

Glad to hear that it solves your problem. Cheers!

@hafizsultan

Is there any way to summarize results from the intersect formula:

VAR commoncustomers =

INTERSECT ( listofcustomersonlastdate, currentlistofcustomers )

I would like to get a grand total of the weekly or monthly subtotals but can’t figure it out - any insight would be appreciated.

Hi @Swhs24,

I think in this case you will have to get list of monthly customers just we did for weekly customers and do one more intersect/union as per your requirement just like below:

EVALUATE

VAR tableA_values = VALUES('Table-A'[Name])
VAR tableB_values = VALUES('Table-B'[Name])
VAR tableC_values = VALUES('Table-C'[Name])
RETURN
INTERSECT(
   INTERSECT(tableA_values,tableB_values),
   tableC_values
   )

Please send some sample file and sample output if you are unable to get your required results.

Kind Regards,
Hafiz