I have tried to solve this issue to no avail so I wanted to reach out to the community for some guidance.
I have three sales categories and when a category is selected along with a period, I want to see only customers who came on in that period for the selected category. I am able to get this view just fine BUT I can’t seem to figure out how to track sales in subsequent months.
For example: if I want to track sales to new customers who came on in Q1 2020, and I select period Q1 2020, my visual is limited to only Q1 2020, how would I see subsequent periods after Q1 2020 for the selected new customers.
I’ve attached a mock up of the data with requirements.
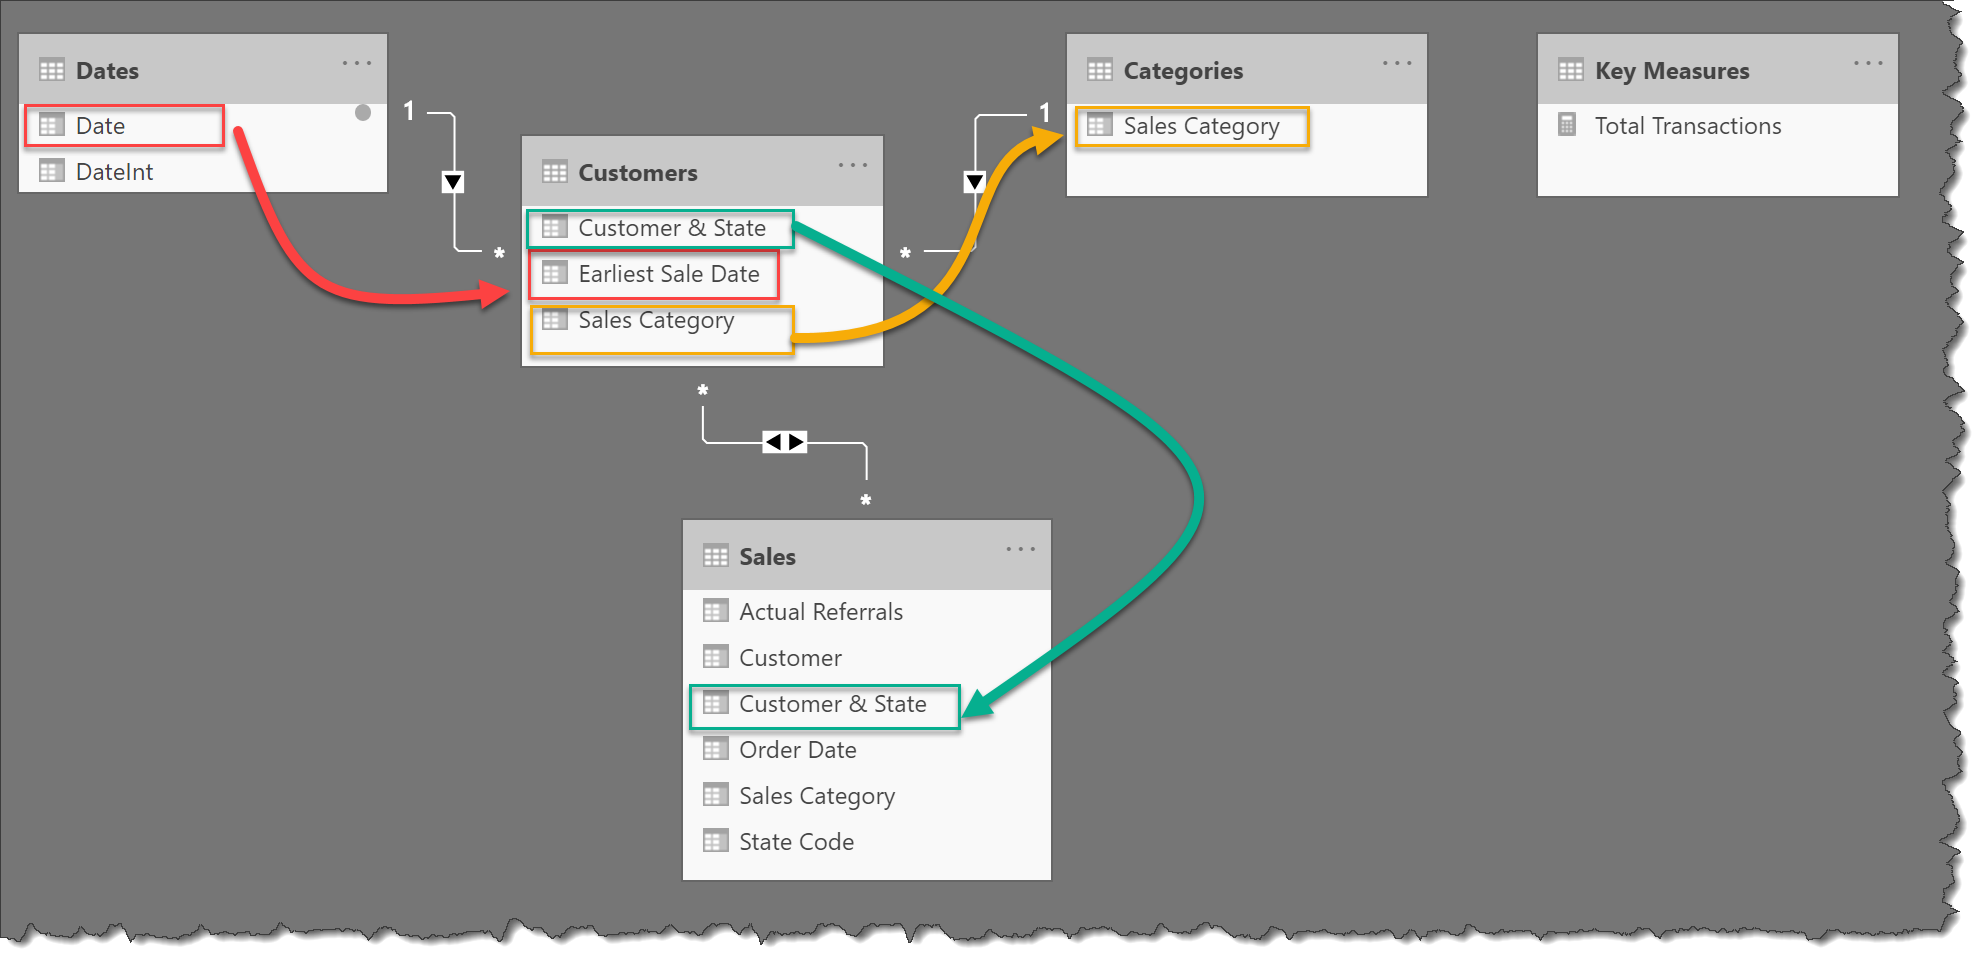
This is a poster case for data modelling. To start, I imported your base data as a staging query, then created Reference tables for Sales, Customers, and Categories, then added the eDNA extended date table. I then added a calculated column to the Customers table for [Earliest Sale Date] and used this to link to the Dates table.
Earliest Sale Date =
CALCULATE( MIN( Sales[Order Date]),
    ALLEXCEPT( Customers, Customers[Customer & State] )
    )
I was able to show something, but needed to use a bi-directional relationship (not recommended).
Hi @msedlak , did the response provided by @Greg help you solve your query? If not, how far did you get and what kind of help you need further? If yes, kindly mark the thread as solved. Thanks!
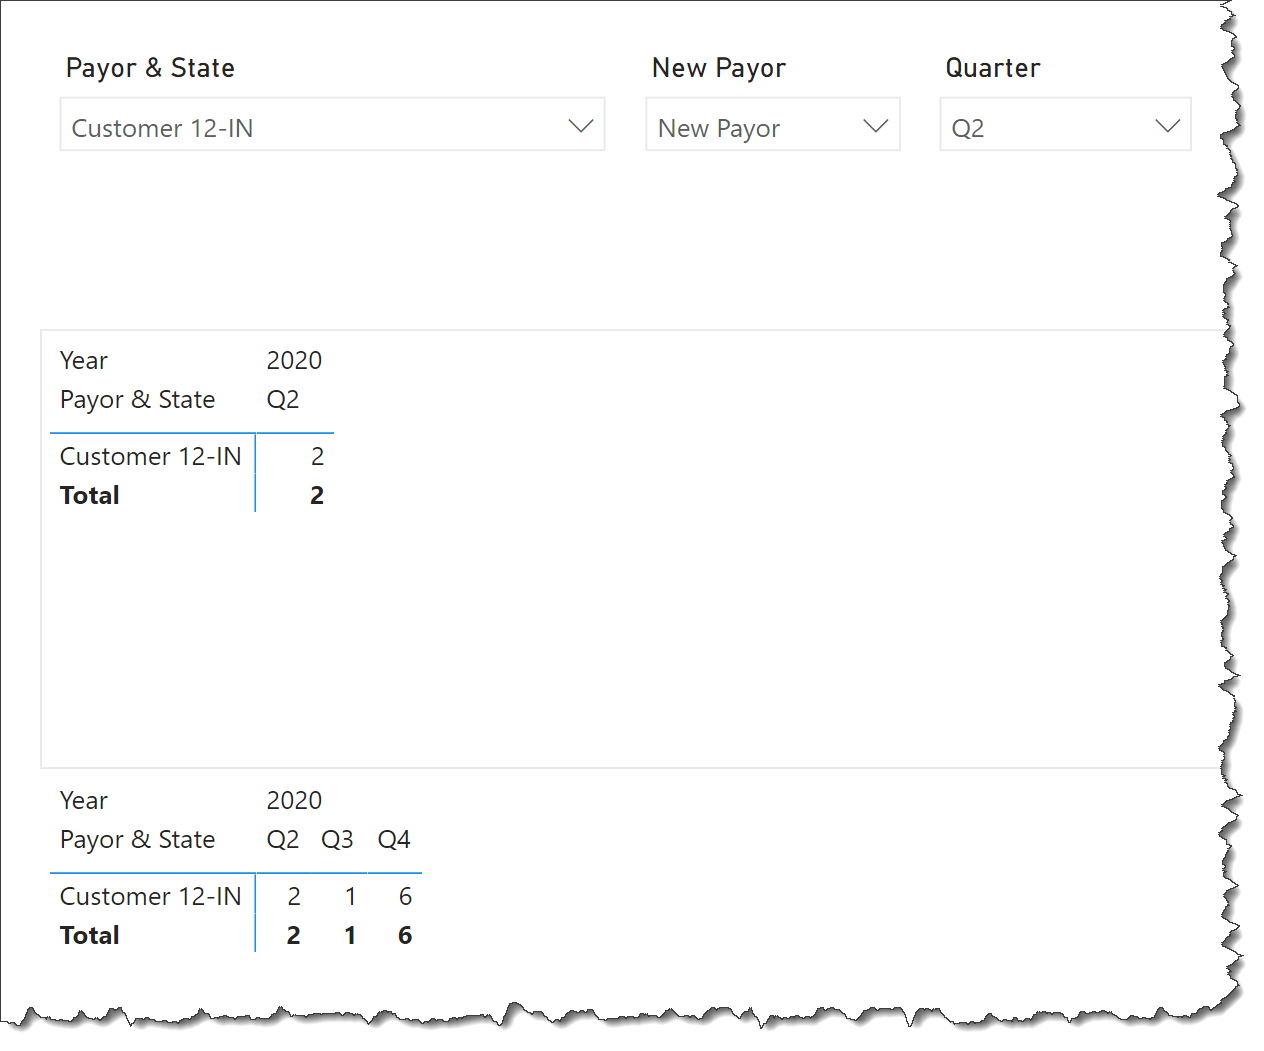
@Greg Ok, I have mocked this up to show where I am hitting a wall. I have built two tables.
Table 1 Showing all customers labeled as new, which means they have been with the company for <= to 24 months.
Table 2 showing new customers based on the month they came on board. You will notice in this table, Sales are only accounted for in the month they started with the company. No futures months sales are accounted for in this table. Note: Customer 12-IN shows 1 sale in Qtr 2, however in Table 1 you can see all the sales for that customer.
I would like to Table 2 to show total sales for all periods where customer has label “New Payor”. It currently only shows sales for the month where payor is considered new. Does this make sense?
Hi @msedlak. The issue with Customer 12-IN is the data: there is a sale before the record designated as “New Payor” for this customer. If I change the calculation for “New Payor” from
New Payor = IF( Sales[Customer Age] = 1, "New Payor", BLANK() )
to
New Payor = IF( Sales[Customer Age] <= 1, "New Payor", BLANK() )
I see the “2” you’re looking for in your second matrix.
Or perhaps its just a sample data issue for this customer?
OK, so the culprit was trying to use the same measure in both tables. If you create a new measure to use in the second matrix and remove the filter on the “New Payor” slicer, then you get 2, 1, 6 in the second matrix for Customer 12-IN.
All Sales Since New =
VAR _NewPayorQuarterStartDate = STARTOFQUARTER( Sales[Payor & State Start Date] )

RETURN
CALCULATE( [Total Sales],
    ALL( Sales[New Payor] ),
    FILTER( 'Calendar', 'Calendar'[Date] >= _NewPayorQuarterStartDate )
    )
@msedlak nothing to apologize for … getting all involved in a question “on the same page” always requires iteration, so expected (can you tell I’m a consultant?). Greg