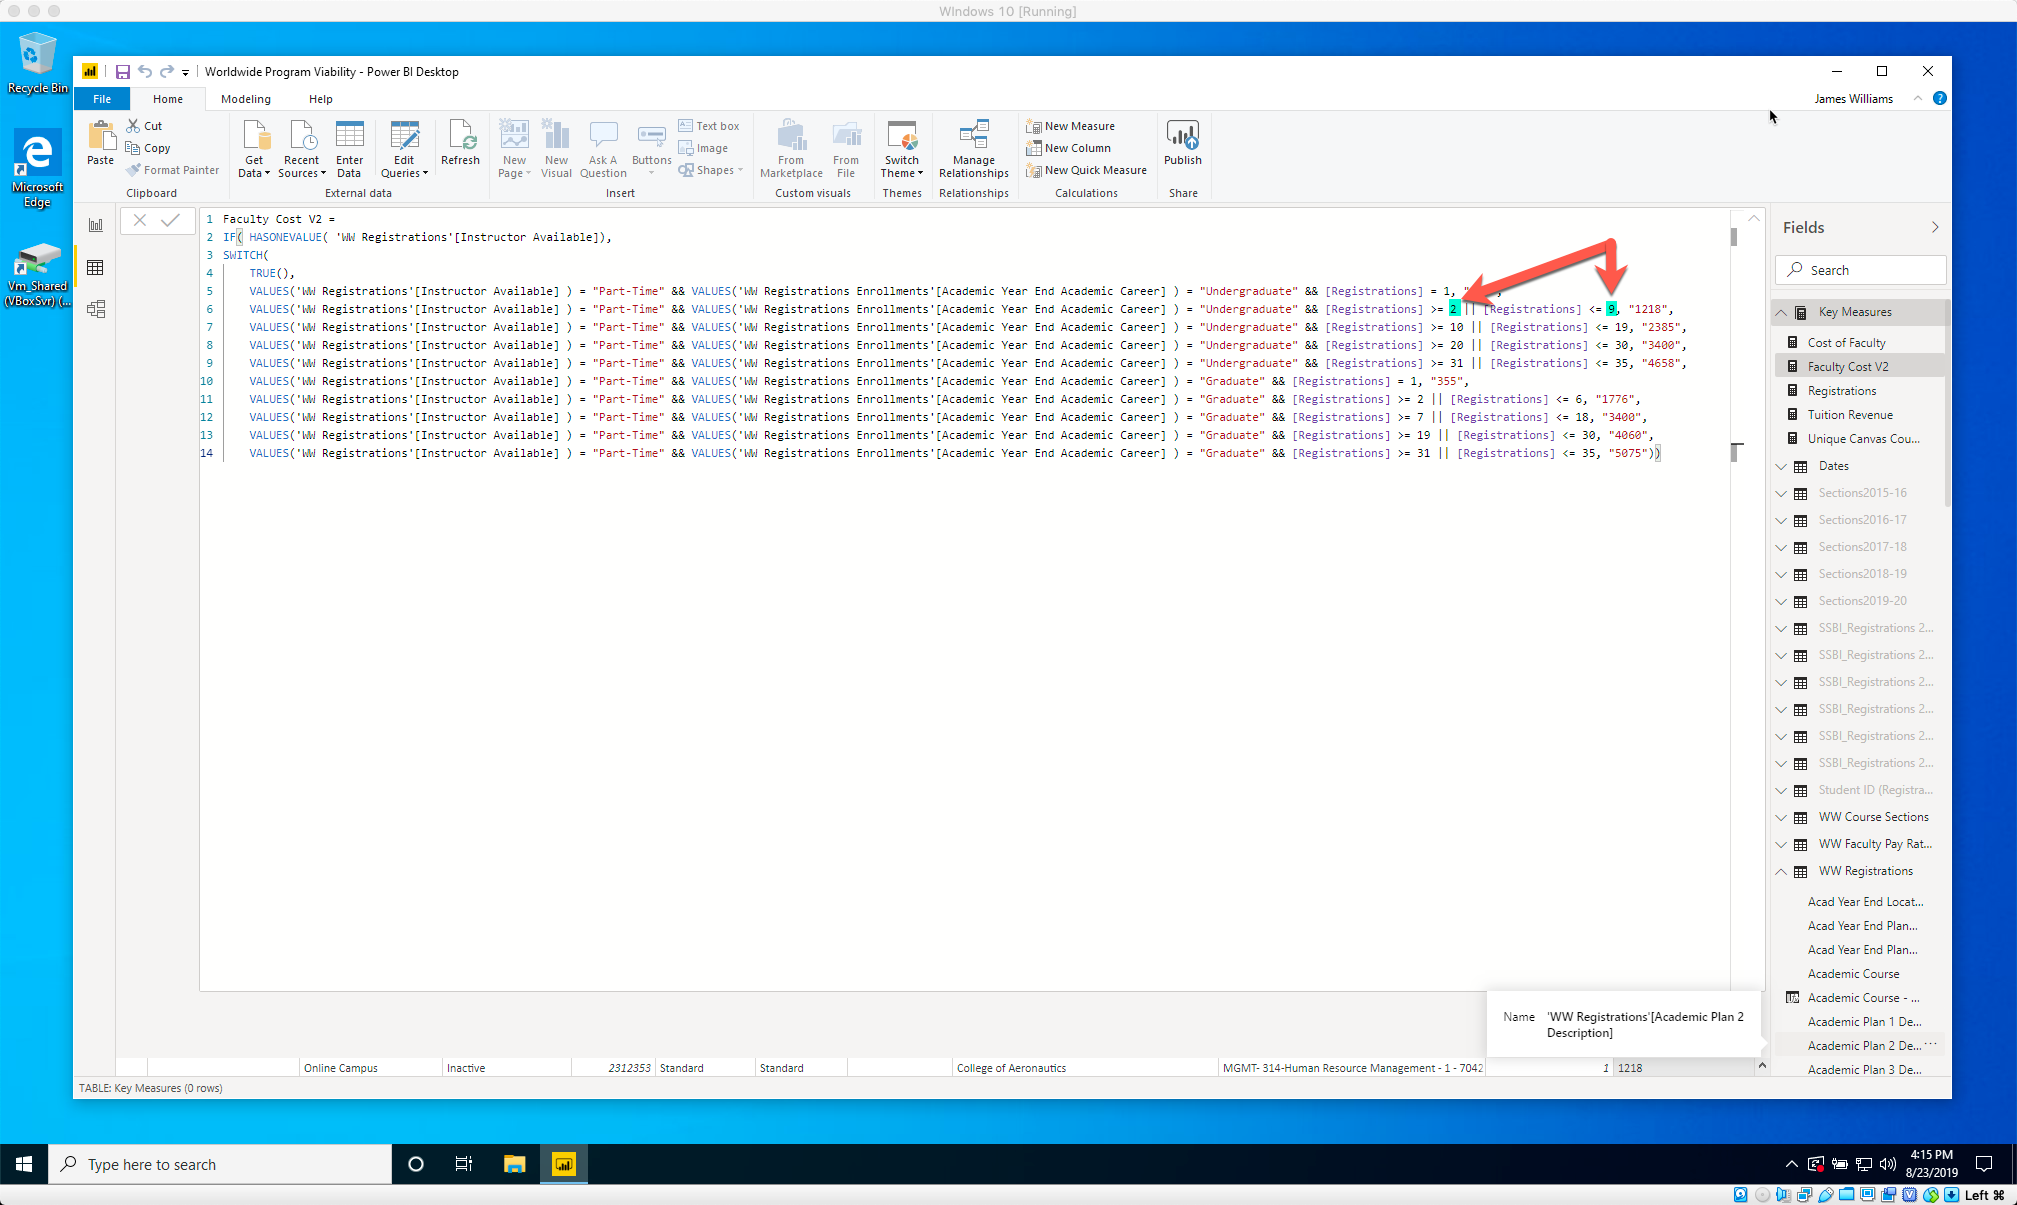
We need help with figuring out the proper syntax to use for comparing measure values that fall within a range of values. For example, in the “Faculty Cost (WWReg)” calculated column below, we are wanting the value of 1218 to be returned when all conditions are met. However, even though the formula does not yield an error, it returns as “blank”. It has to do something with the syntax of the whether Registrations is greater than or equal to 2 AND less than or equal to 9.
We’re not able to use a summarized table because the information we need is by the Course within a Program belongs to. The course and the amount of students is what makes up the cost.
Here is the “Registrations” measure:
Registrations =
CALCULATE(
SUM(‘WW Registrations’[Course Registration]), VALUES(‘WW Registrations’[Academic Year]),VALUES(‘WW Registrations’[Academic Year End Academic Plan No Roll-up Description]),VALUES(‘WW Registrations’[Academic Course]))
Below is something else I tried but I noticed its not respecting the bounds of the minimum number to the maximum number within the range identified and therefore treats everything as if its the 2 to 9.
However, when you have many records the model becomes slow.
In your case the high number of different combinations may be served better with a solution in PowerQuery. Create a table from the main table showing all possible combinations and allocation and merge this table with the main table. Suggest to start with a small dummy dataset to test.
There in lies my problem. So what determines the amount is the number of students in a course and the rate is not fixed. The problem is after determining the rate by the course it needs to be rolled up to the degree program but 90% of the courses can be used in just about any degree program and either the undergraduate or graduate level.
This is the reason I cannot roll anything up or even create a summary table because each degree program based on the number of course combination could have 78 different combinations and thats across 35 degree programs.
I followed Sam’s approach to complex situations by walking the scenario through piece-by-piece but the point rollup-summarization is where it falls apart.
I am not sure how to start this in Power Query and do all of those things. I know I can use the conditional functions that are built into the Power Query side but thats where the knowledge runs out for me.
In the query editor, you need a list (query) of all the possible combinations with the value you have given it, pls explain this value, is it a fixed code or count of records? Once you have this table you can merge it with your facttable. Consider this merge as a super lookup function, you can merge based on multiple columns in your combinations query and facttable. So columns D,F,J innthe facttable with column A,B,C in the combinations table. This creates a new column in your facttable (a table) which needs to be expanded and then you can expand to only show the lookup value in your fact table, corresponding per record with the combinations in that record. Check YouTube, key words merging queries in power bi, for an example.
This was a separate table I created that had all the factors that determine the faculty pay.
The Min and Max is based on the component of the formula that would look at the sum of registrations.
The columns:
Available
Career
Location Type
Course Type
are in the main table and when it counts the registration by unique course the min and max was intended to allow the appropriate Pay Rate to be returned for that course.
It is Sunday now and I will be out for training sessions Monday Thursday and Friday.
Will try to have a look for you on Tuesday, in he meantimedive into Power Query as I suggested.