And at first I though it worked perfectly - but it seems to ignore perhaps 5% of my groups and I cannot understand why
My Measure
Number of Students =
CALCULATE([Student options],
filter(VALUES(Options[Course]),
COUNTROWS(
    FILTER('Class size Thresholds',
    [Student options] > 'Class size Thresholds'[Min] && [Student options] < 'Class size Thresholds'[Max]))))
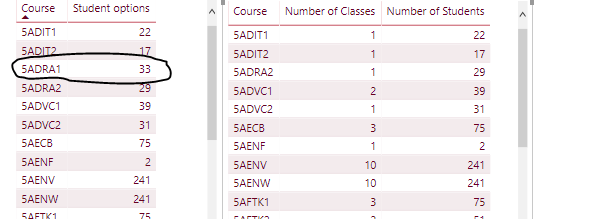
Note that the row circled in Black exists in the table on the left - but when I use the supporting table it does not. The other values appear as expected
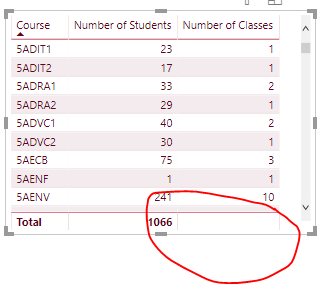
I also need the total of the number of classes - the table doesn’t total them itself (so I just want to add it to a card
I’ve made a few attempts at writing a dax sumx formula on a summarize table but
I can’t get my head around it -
I think that my number of classes is aggregating before the sumx
Any help or suggestions greatly appreciated
I have made some changes to the DAX formulas to reflect what you are looking for. If you have not already done so, make sure you watch the videos on context.
There is no need for a “X” function, always start with simple DAX and if you notice behaviour that you do not wish look at more advanced solutions. Create measures for a column, rather than using the column in the value part of the visual.
Thanks for the reply Paul
I might need to better clarify what I am trying to achieve
I have students and courses and I want to know how many classes I will need to run based on the courses that the students have chosen
I have used the supporting table to set the thresholds for the number of classes that will be required.
E.g. If there are 30 students in a course that will only require 1 class
If there are 33 students that will require 2 classes.
I then want to be able to determine how many classes there are in total.
This is why I want to sum the number of class from each row and why a basic sum does not give me a useful total
Perhaps - the supporting table isn’t the best strategy?
Ok, a supporting table is fine, you could divide by 30 and round up as well. You need to tweak your formula a little bit, I am away for a couple of days so check the video about Grouping and segmenting.
I have added a pbix with the total classes, check the Table that has been created with SUMMARIZE and the DAX formula for the segmentation. There are many ways of doing this I guess, probably a COUNTX with a virtual table could have done it, but I avoid X functions for performance reasons and this makes it clearer.
ok, fine. You will realise that once you build your model and add a date table and show start and end dates for the courses in your fact table, you need to tweak the logic accordingly.
Cheers Paul. One of the perks of living in the southern hemisphere is that the academic year fits nicely inside a calendar year - so my date table is very simple - it is just a “year” table
I added “year” to the “summarize table” and all results matched what was expected
Summ
I see, in your current set up every academic year is one event, so you do not need to calculate across multiple years. However, if you add data for more years to the fact table, you could analyse the courses over time, which could provide interesting insights.
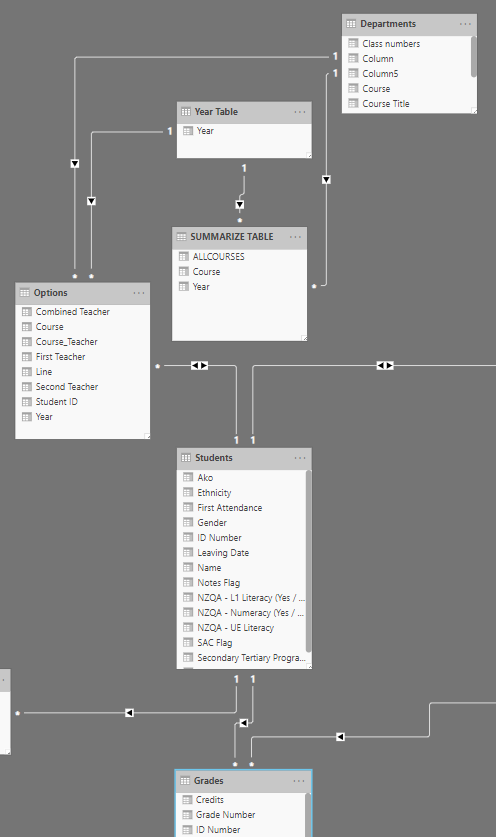
Please check the videos on modelling, your model should look more organised and you should avoid many to many relationships.
Just in case you may wish to add a date and benefit from the filter behaviour of slicers and other visuals, see the DAX formula, containing a virtual table (like the table in the example).
This X formula can be used instead of using the extra “SUMMARIZE TABLE”, given the fact that your data set is not too big, this will work fine and it simplifies your data model a little bit.
Classes with SUMMARIZE virtual table =
SUMX(SUMMARIZE(Options;Options[Course];“ALLCOURSES”;[Number of Students]);[# Classes per Course])
Great!, Thanks Paul
With each Student having having multiple Courses and each Course having multiple Students I don’t think think there is any way around the many to many relationship.
My understanding is built on those modelling videos - so I’m uncomfortable with the many to many as I don’t fully understand the repercussions - but it does seem to work
I discussed this with Sam a month or two back