I’m not sure if this really is a slowly changing dimension question or not, but the issue is as follows:
We’re a sports medicine hospital, and for one study we’re doing we want to match up a strength test result with a patient’s bodyweight to end up with a force/bodyweight measure.
The issue is, our most reliable bodyweight measure isn’t done on the same day as the strength test, so I have one table with patient identification numbers, and their bodyweight measures, along with the date we got the bodyweight:
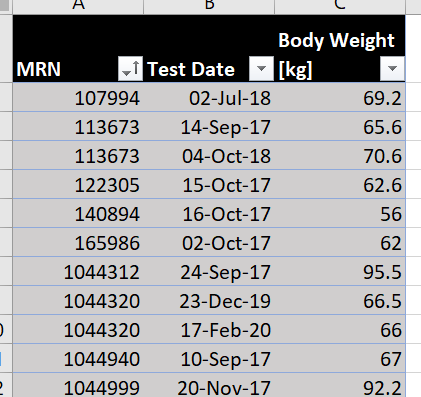
If we take our first subject with 2 weight measures (MRN: 113673) whose weight went from 65.6kg to 70.6kg in 13 months - if I have a strength measure that’s done close to Sep 2017 I’d use 65.6, and if it’s in Oct 2018, I’d use 70.6. If it’s March 2018, then I’d use the mid point of these two as a best estimate, etc.
I’ve thought of a ridiculously big excel table which has each person in a column, and all the dates as rows, and then I could manually interpolate between the “known” values, but since I’m talking about more than 1,000 patients and 5,000 measurements, this is unwieldy and not future-proof.
Any thoughts on best practice here?
I dont see why this couldnt be done in. Just need to define what is “close” and then when to use the midpoint. Then is it the midpoint of all available bodyweight cals for the MRN, or is the last 2, 3, etc… Need to be specific here so DAX “knows” what path to take.
Also, some sample data in a PBIX file would be preferred. Along with a quick mockup of what you would want/expect the out come to be.
Hi @rodwhiteley, we’ve noticed that no response has been received from you since the 7th of May. We just want to check if you still need further help with this post? In case there won’t be any activity on it in the next few days, we’ll be tagging this post as Solved. If you have a follow question or concern related to this topic, please remove the Solution tag first by clicking the three dots beside Reply and then untick the checkbox. Thanks!
Apologies for not replying - snowed with COVID-19 related work.
I’m not sure how I am best able to interpolate from the measures I have.
Here’s a snip from a pivot table with every person in the column, and each observation in rows (as dates):
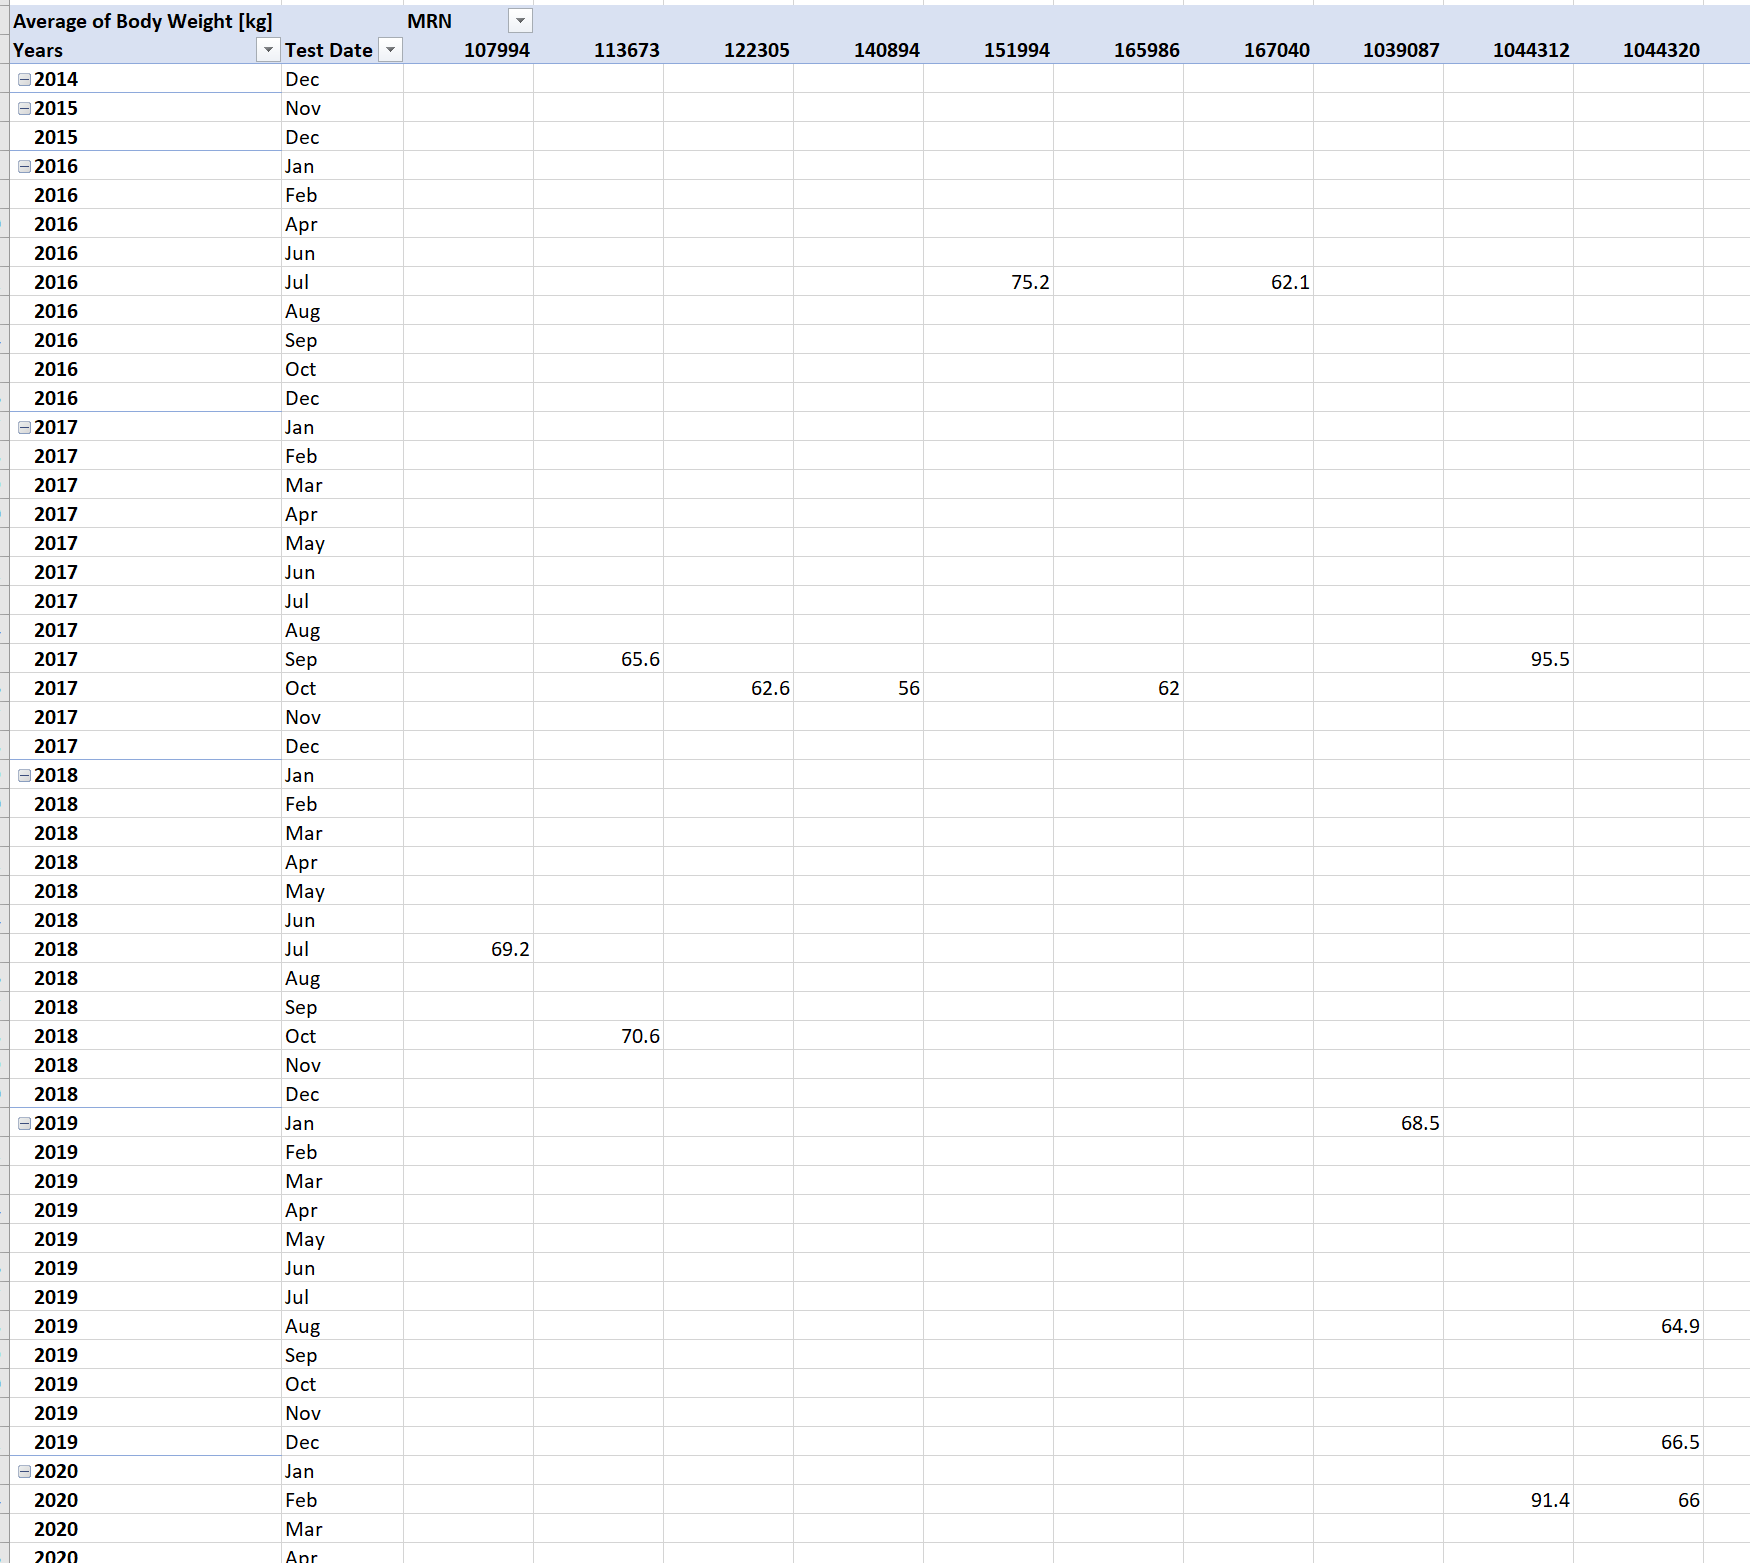
You’ll notice there’s lots of empty cells here - bodyweights get taken at different times to the strength testing.
The “best guess” for someone’s bodyweight on a given would be made by creating a series between each two given “actual” values in a column.
Doing this by hand would drive me insane (there are about 2,000 columns) (and of course I need to drill down to individual days for every row).
Is there a way I could do this in PowerQuery I wonder?
Filling Down/Up in Power Query wouldn’t work, as I want to get there in smooth steps (a linear fit), not simply repeating previous values.
Thanks for any help,
Rod
Hi @rodwhiteley,
Sure. There’s been a lot of demand for this technique over the last week or so…
One thing to note. How to deal with dates after the last measurement? I would suggest retrieving the last know value from the result table in DAX but hey… Just review it and if at any point you consider changing that OR switching to another granularity because now it’s at the at the daily level, you can modify the applied logic accordingly…
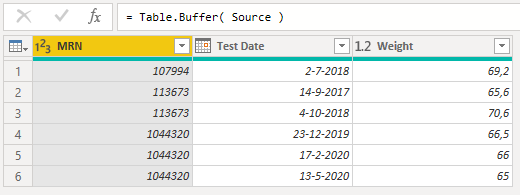
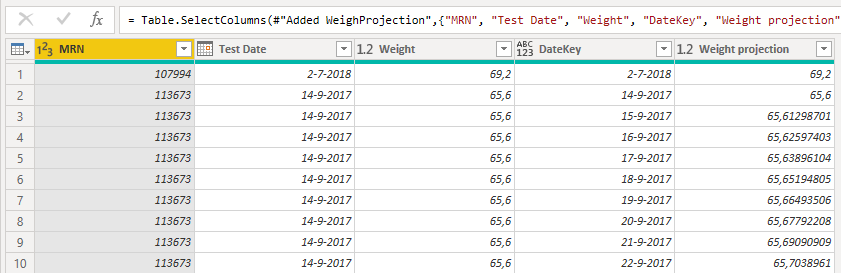
- So I started of with a small sample.
- Manually added a Buffer step to load the table into memory
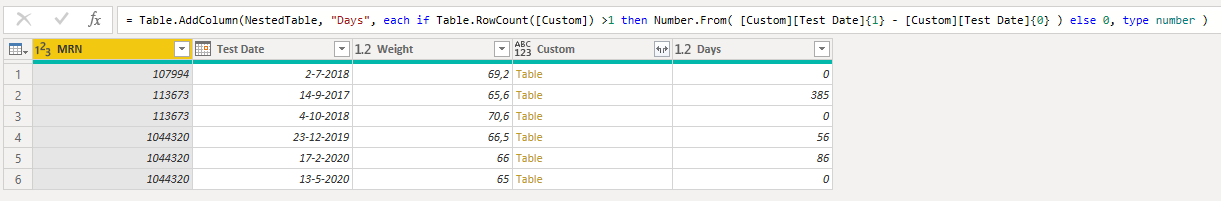
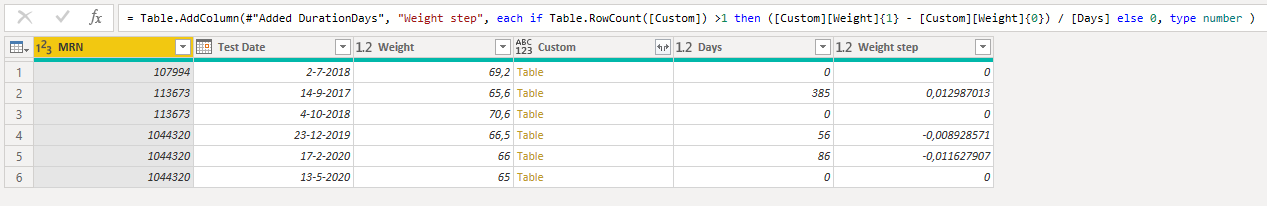
- Created a nested table that contains only records where the [Test Date] from the inner table is greater than or equal to the [Test Date] from the outer table AND where the MRN match.
Sorted that intermediate table and only kept the First 2 rows.
- Determined the number of Days between the 2 [Test Date] values by checking if the nested table has 2 rows and using the access operator to subtracting the first- from the second date.
- Calculated a Weighted step for each day by subtracting the first- from the second weight and dividing that by the Date difference between the two measurements.
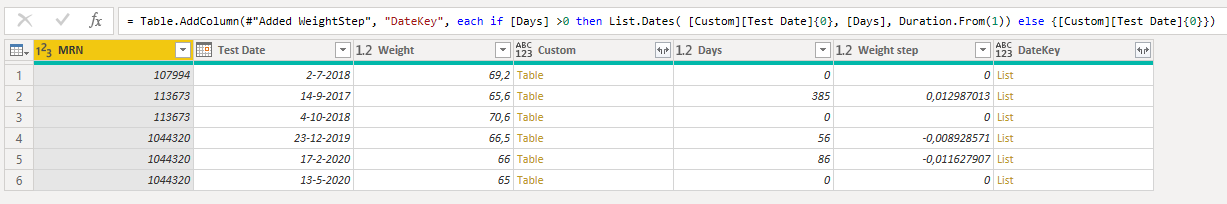
- Created a list of dates to fill the gab
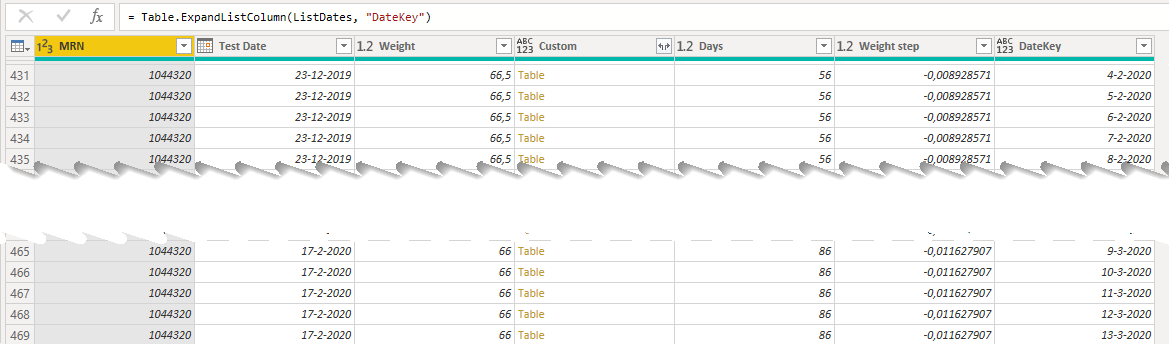
- Expanded those Dates to New Rows
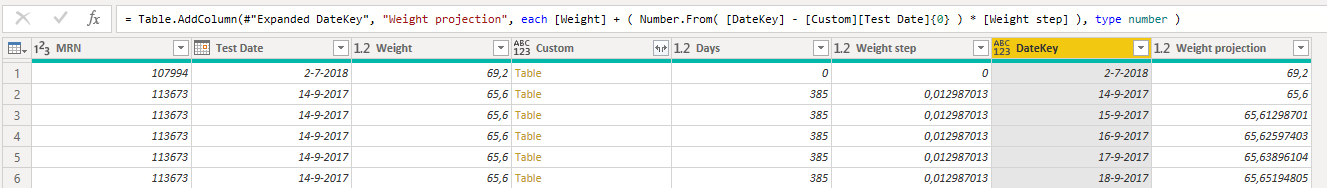
- Added a Weight projection by summing the [Weight] with the Weight step times Date difference
- Cleaned up the helper columns.

.
Think we could consider it a fact table now… You have a Weight value for each Day and can create a relationship between the DateKey field and your Date dimension table.
I hope this is helpful. Here’s my sample file.
eDNA - SCD Body Weight projection over date range.pbix (45.6 KB)
Thought this was a great example to do a video on because it covered some important Power Query techniques others might benefit from as well. So here’s the link to the video on Enterprise DNA TV.
It covers adding Custom Columns, Table.SelectRows to create nested tables and how to modify and extract data from those nested tables. Creating a Date range to Expand to New Rows but also a great way to ‘cheat’ by drilling down, so you can use the Power Query Interface to generate the M code for you, all you have to do is copy and paste 
Although I realize this example is pretty specific I promise the techniques are not. Enjoy.