Sure – see example below using your Current Balance measure.
If you just drop Deposit Type and Current Balance into a Table visual, you’ll get this:
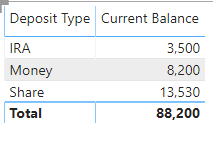
The Deposit Type rows work fine because they are defined in the initial data model, and the calculation is row by row, so IRA, Money and Share produce correct current balance results. However when Power BI gets to the Total row, it doesn’t have sufficient context to evaluate that row correctly, so it basically does this ¯\(ツ)/¯ and hands you a crazy number…
So you need some additional logic to force it to total the column vertically when it gets to the Total row. This is what the following measure does:
 Current Balance Virt Total =

// Creates a virtual table from Deposit Types table also including the Current Balance measure
VAR VirtTable =
    ADDCOLUMNS(
        'Deposit Types',
        "CurrBal", [Current Balance]
    )
//Takes the sum of the CurrBal virtual column
VAR SumCurrBal =
    SUMX(
        VirtTable,
        [CurrBal]
    )

//Tests whether the row in question is a regular data row or a total row.  If the latter, uses the SummCurrBal variable
RETURN
IF(
    HASONEVALUE( 'Deposit Types'[Deposit Type] ),
    [Current Balance],
    SumCurrBal
)
Now when you drop Deposit Type and the new measure into the Table Visual, you get the correct total.
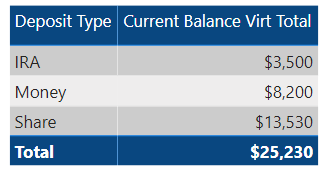
This is a really useful DAX pattern to keep in your toolbox, since the incorrect totals problem comes up all the time.
Hope this is helpful.
- Brian
YTD Interest Test - solution.pbix (60.6 KB)