Please include the last measure as well. it didn’t make it into the post
Can you try this, I won’t to see if it works.
CALCULATE( DISTINCTCOUNT( Students[Student ID] ), Registrations )
That’s it. It may or may not work I’m not sure.
If this doesn’t work, you model will have to change, as the way it is currently this isn’t possible
What about this also
Unique Students = CALCULATE( DISTINCTCOUNT( Students[Student ID] ), 'Course Completion' )
Any reason you need the distinct count of registrations. What’s wrong with using the student ID in the course completion table?
Hello I thought that I could use the Student ID from the Student Table but that doesn’t seem to work.
I can confirm that using the below formulas work for their respective visuals.
-
CALCULATE( DISTINCTCOUNT( Students[Student ID] ), Registrations )
-
Unique Students = CALCULATE( DISTINCTCOUNT( Students[Student ID] ), ‘Course Completion’ )
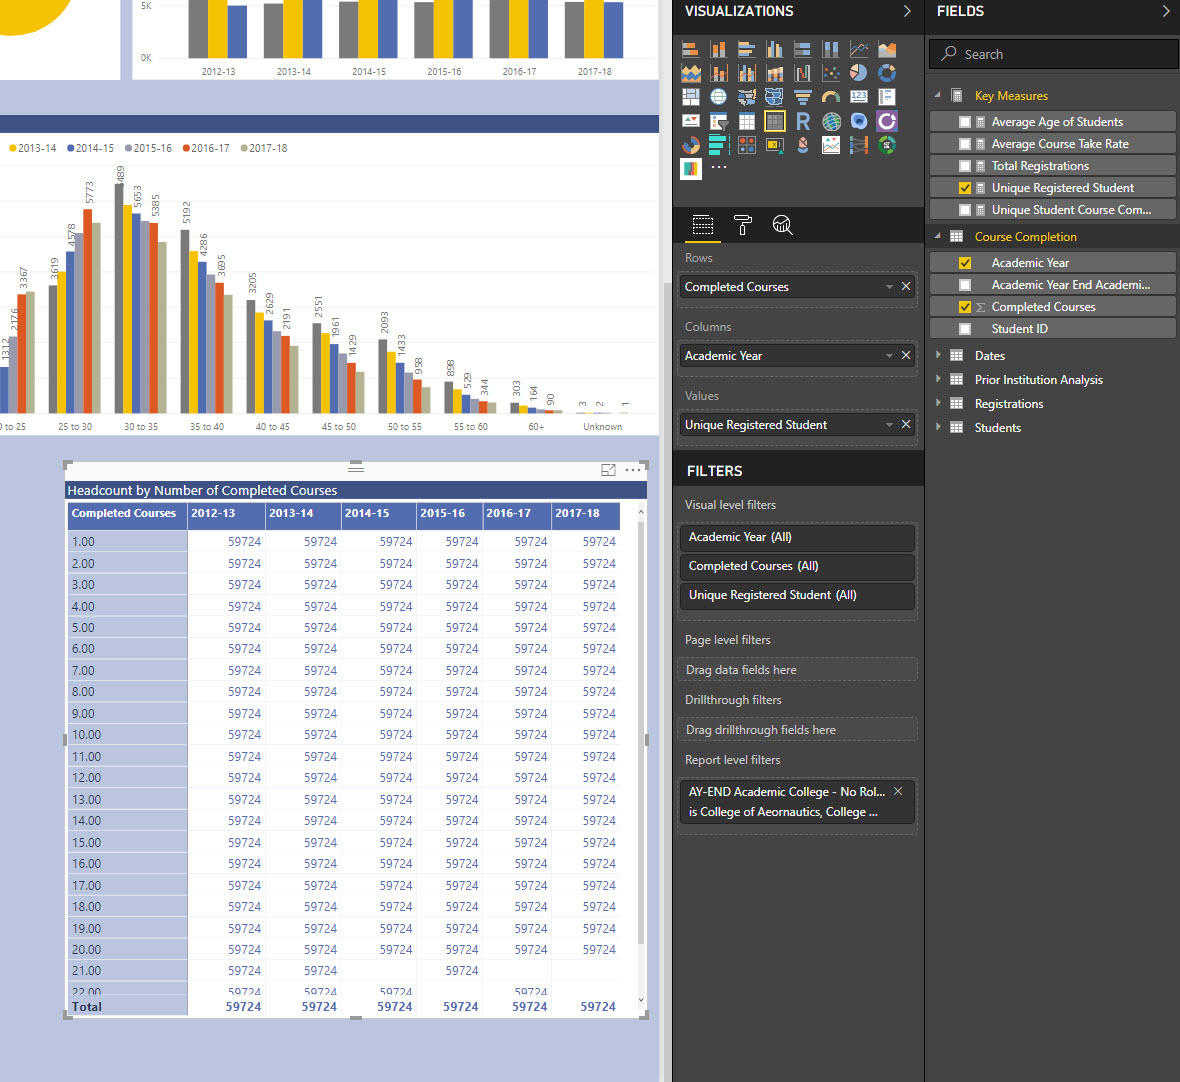
Does that mean I will need to have multiple “Unique” student measures depending on the table? Since it looks like I have one that is for the ‘Course Completion’ table.

The only problem now is the page filters since derived from the ‘Registrations’ Table, filters all visuals on the page except the ones associated with the ‘Course Completion’ table. I figured the path of least resistance is to just put the Course Completion stuff on its own page so it can use its own filters and I just can’t use the Filter Syncing Function.
The reason the filters are not in the ‘Students’ table is because students have multiple academic years, multiple location types, and multiple locations since they are mostly military students who are only stationed in one place for a short period of time. So I had to leave those filters and information in the ‘Registration Table’ since each row represents a registration and includes their information at the time of that course, allowing for the course term by term information such as location and location time along with academic year to be shown.
Some interesting points you make here and I think maybe there’s some trades offs due to the complexity of the data.
If this is the most optimal model, then yes I think you’ll have to customize formulas for the particular way you want to showcase them and then set up your report so they give the right answers.
I would just be very clear in the formulas as to how they work, and place lots of comments in them.
Alternatively you would need to adjust the model and optimize it more for what you need.
There’s is actually always trade off when developing Power BI models, I guess your seeing quite early on where those need to be made and worked around.
Maybe there is a way to improve the model here, but it’s difficult to get mind around each different complexity of the data AND also know exactly how you will ultimately need to showcase this to your consumers, so I’ll leave it to you to make the right choices there.
Sam