So I think I am doing something wrong. Since I had something set up before joining Enterprise DNA and after watching some of the videos I am attempting to clean up the model and follow some of the best practices. But I think the number of things I need to be able to do is further complicating what has to be setup and connected to what relative to the video demo.
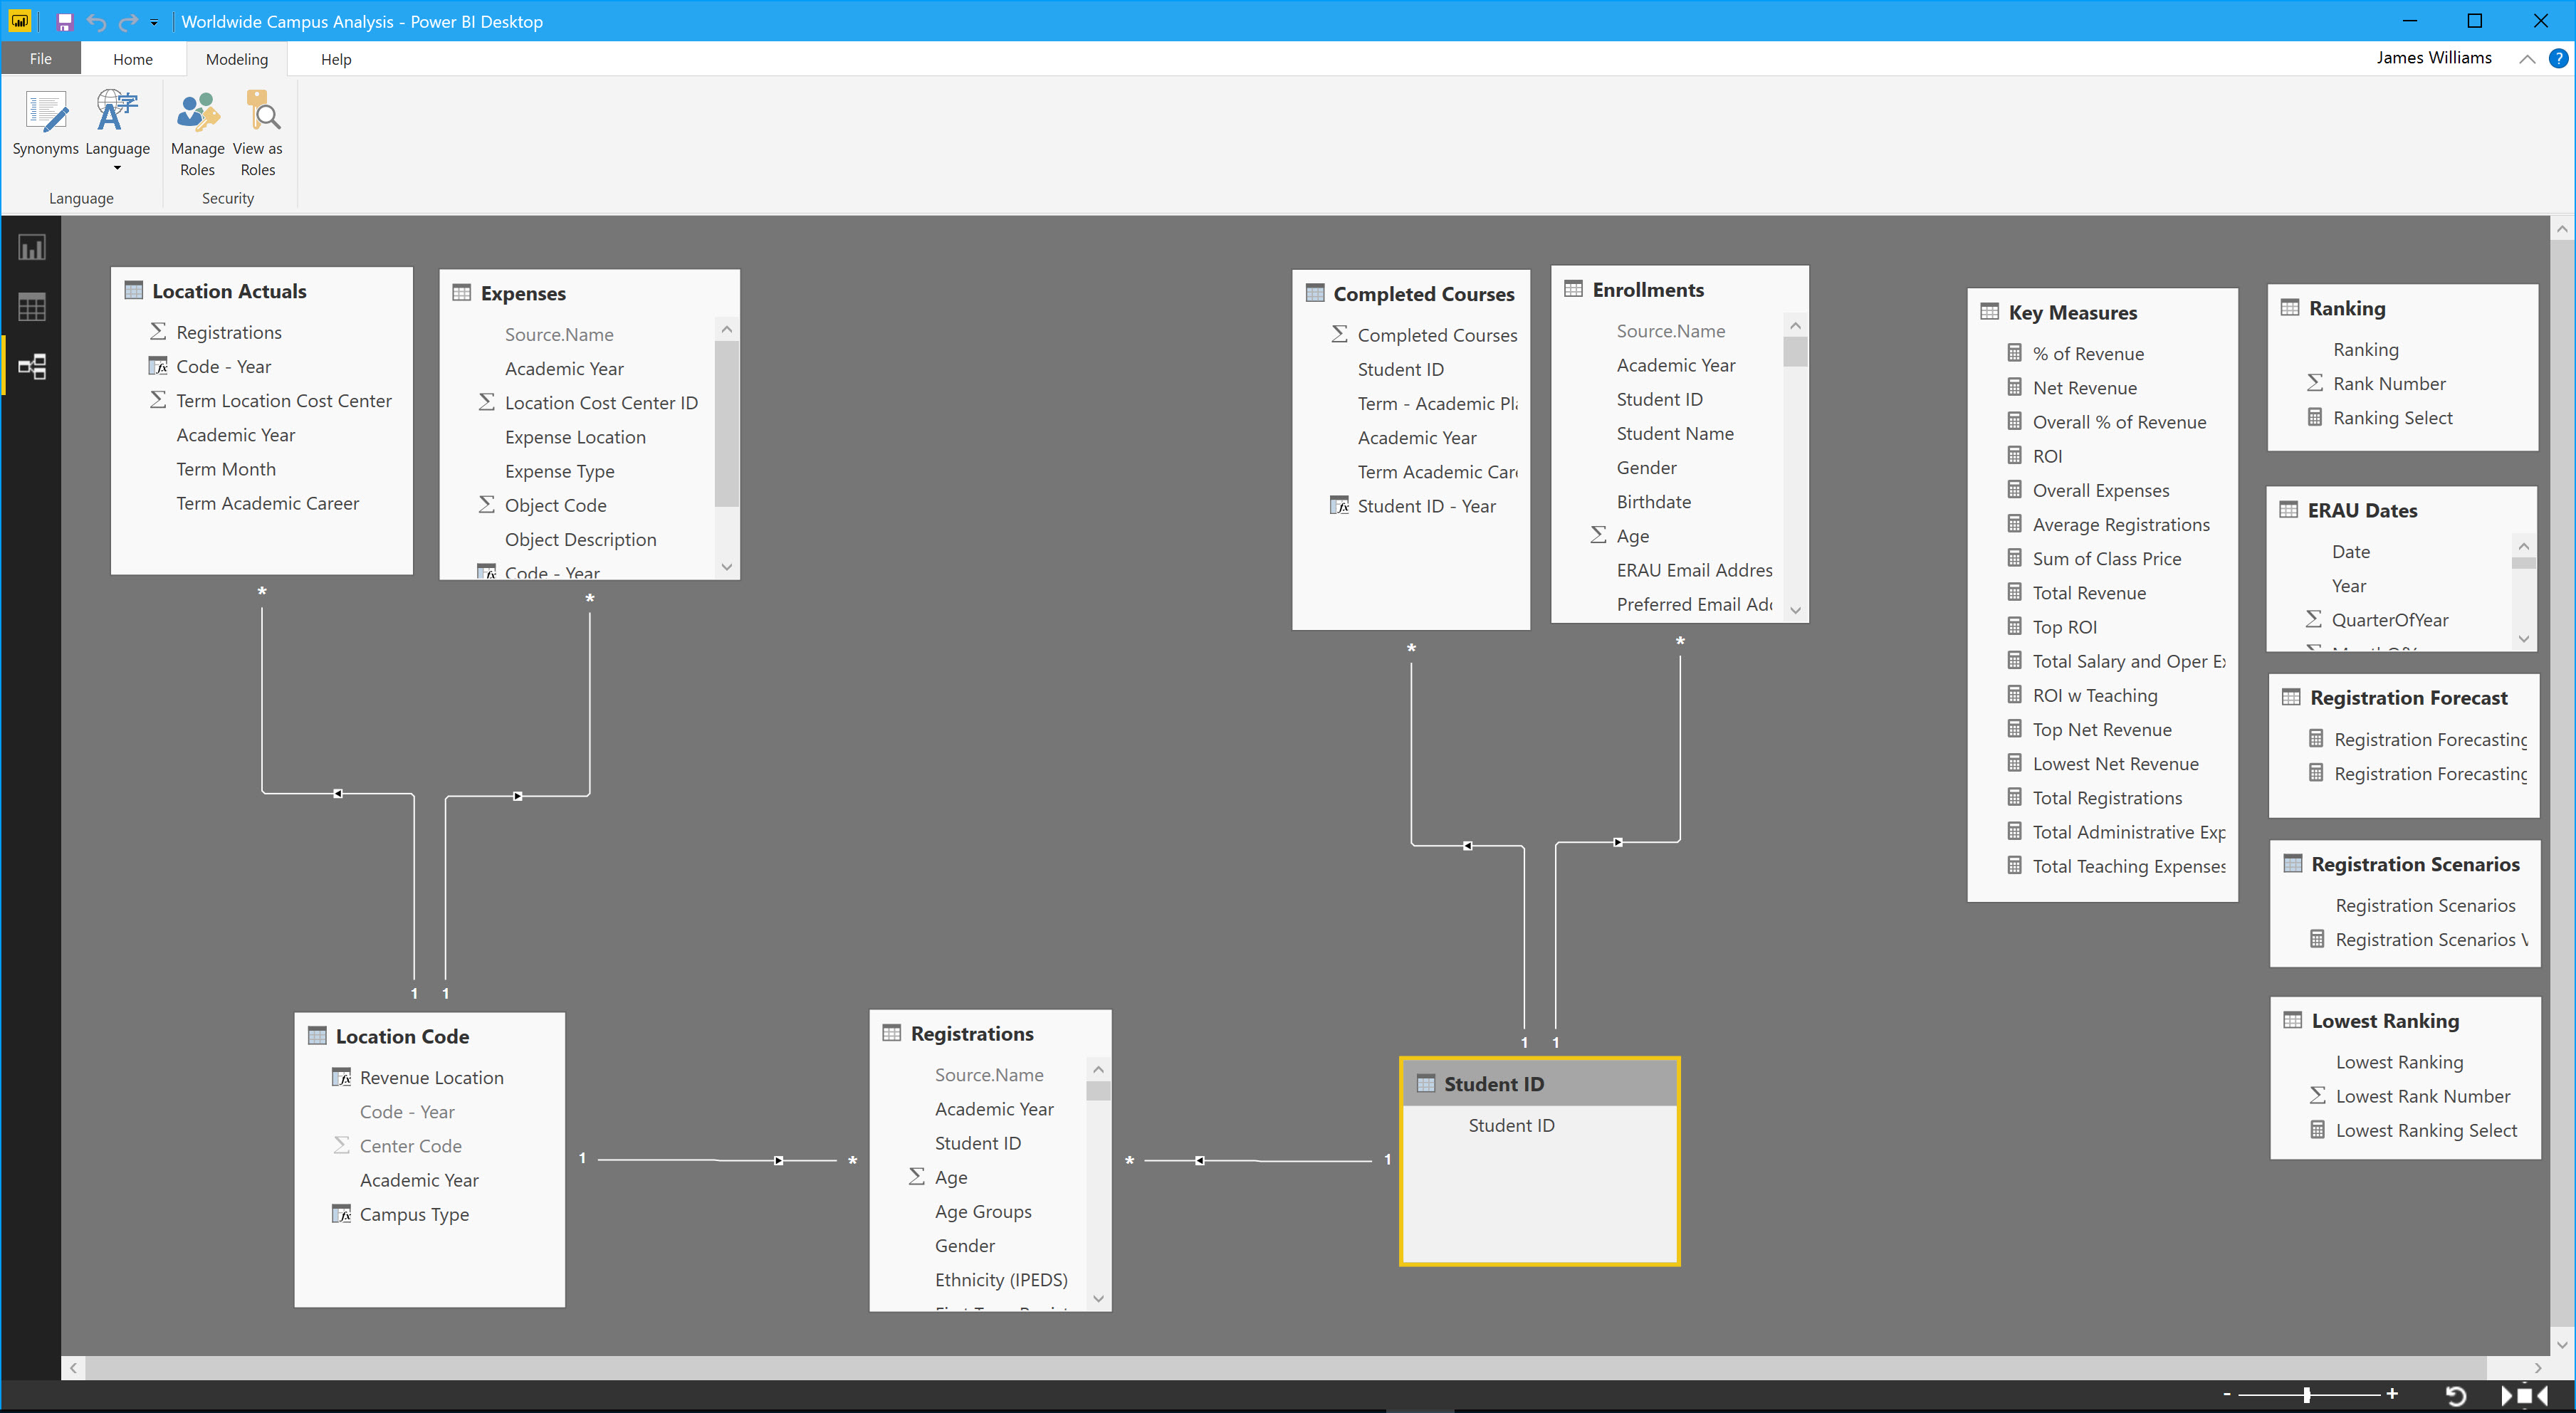
So the only thing that existed at the time in this model was a central table called “Location Code” and that allowed me to use the ‘Enrollments’, ‘Registrations’, and ‘Expenses’ tables to look at Enrollments which is Headcount, Registrations which is courses taken by students that name up the headcount, and Expenses which is the cost of running a location. The ‘Registration’ table allowed me to calculate Revenue.
Now to complicate the things I need to be able to look at ‘Registrations’ by the individual student and leverage the demographic data about the student that would be found in the ‘Enrollments’. Since the Student ID repeats in both tables I cannot create a relationship between the two tables so I created a table of just the Distinct Student ID’s called ‘Student ID’ so that I could link the two. The problem is as setup I cannot use “Student ID” from the ‘Student ID’ calculated table and connect elements from both ‘Registrations’ and ‘Enrollments’. The next part of it is I created a ‘Completed Courses’ calculated table that counts registrations in the table ‘Registrations’ by Student ID, Academic Year, Academic Program, Academic Career. Because the other goal is to look at how many courses students are taken in an academic year. The goal is to be able to look for distinguishable traits (demographic variables from ‘Enrollments’ table) of students as they are group by the number of completed courses.
I wish I could deconstruct the entire Power BI setup and start anew but I cant. Thoughts, help?
Let’s fix the model here first, as this is the problem.
You haven’t identified from what I can see what is a lookup vs a fact table.
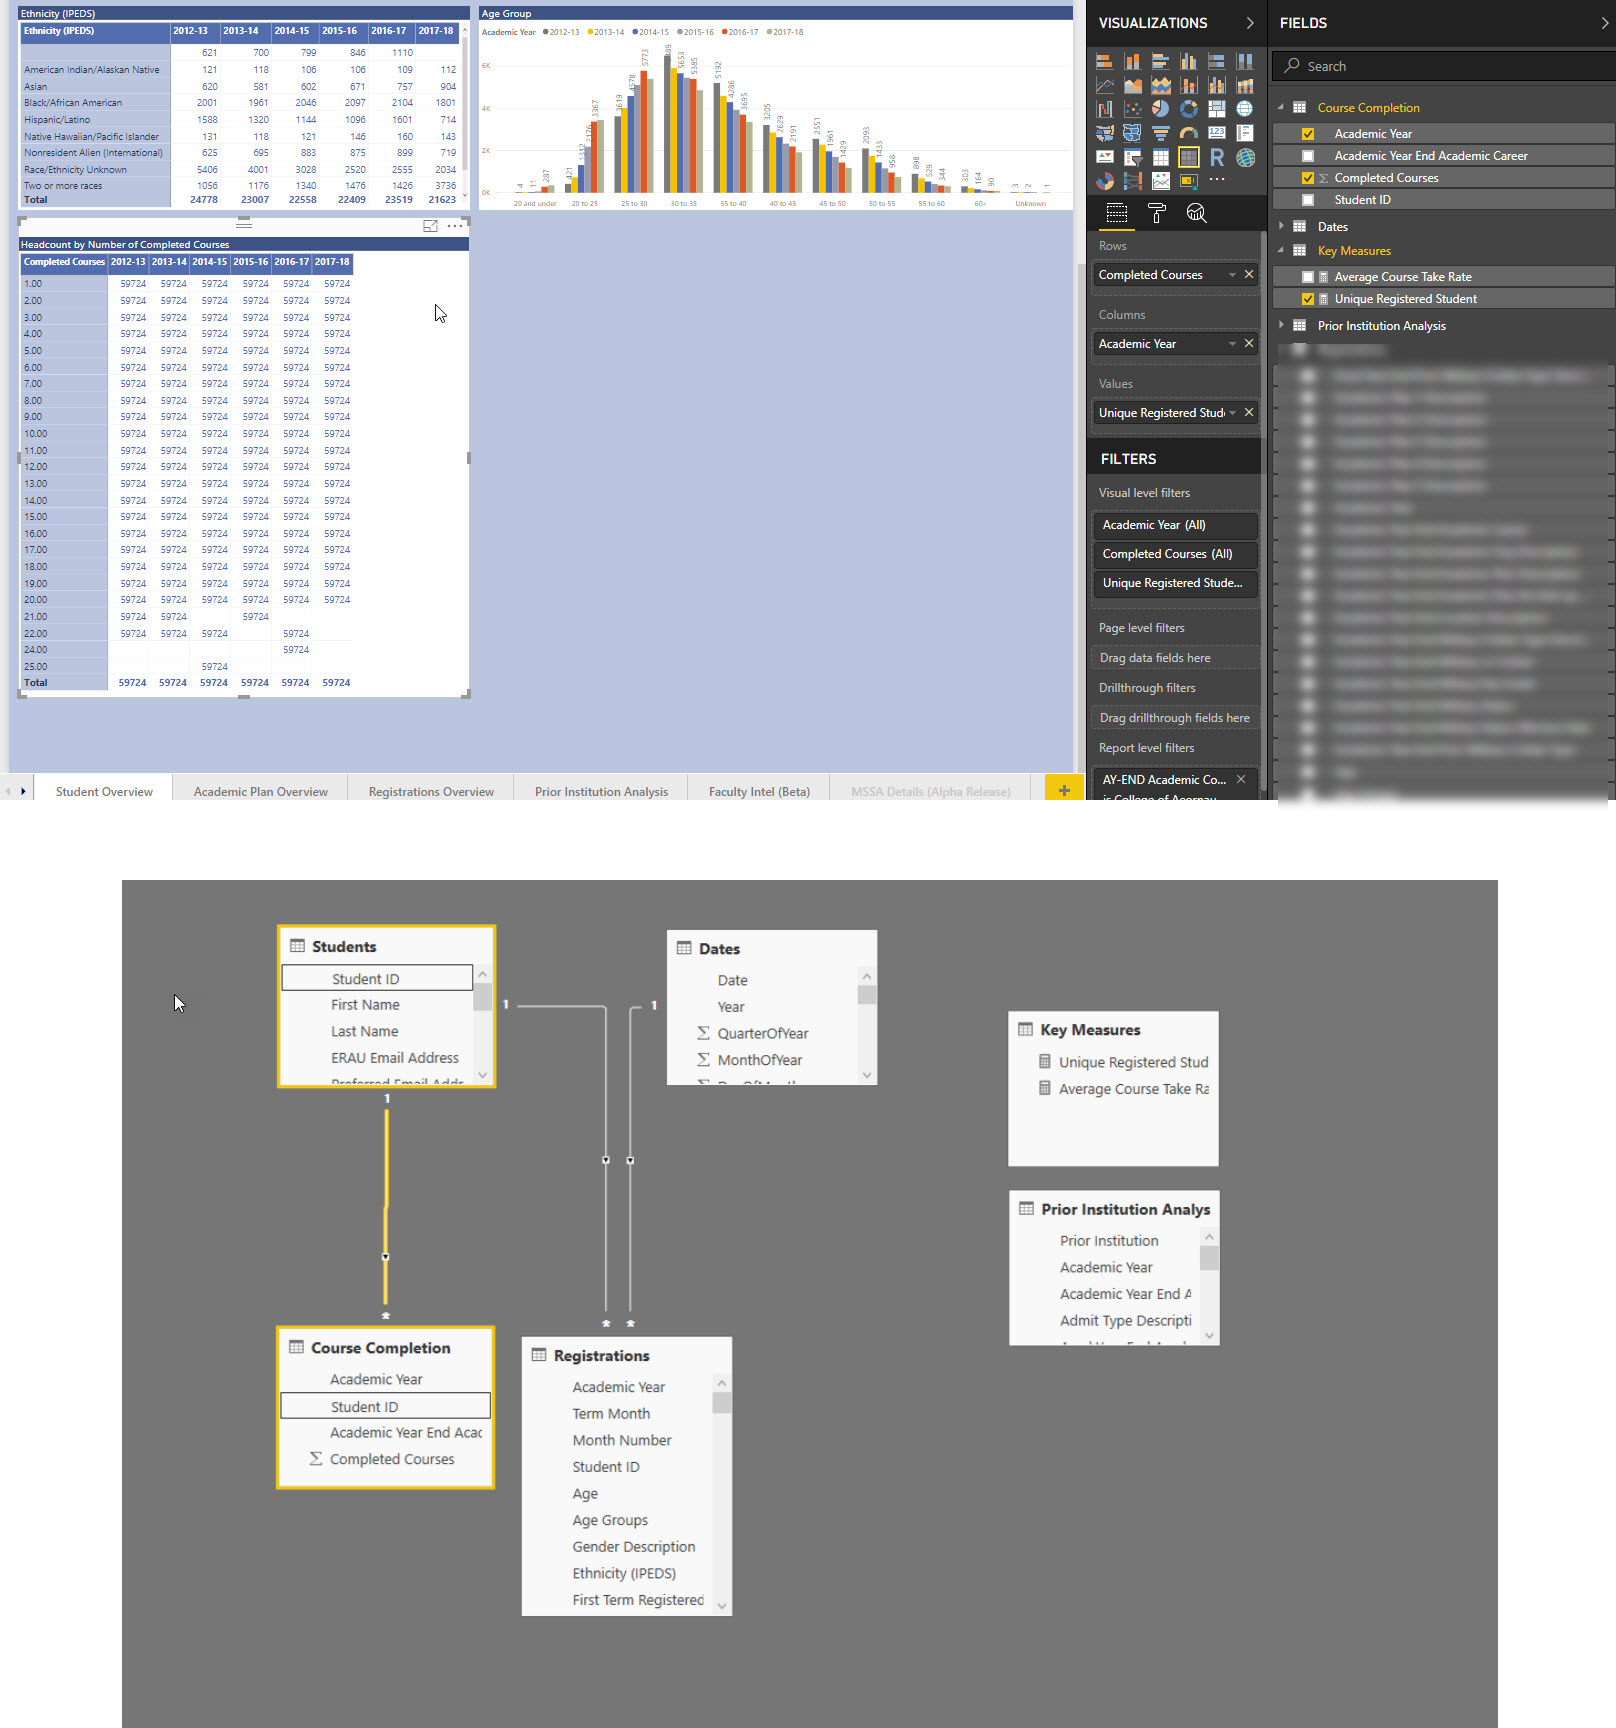
The fact tables should be (from what I can tell) Registration, Enrollments, Expenses, Completed courses. And your lookup table should be Locations, Locations code, Student ID.
These need to be up the top and the fact table down the bottom.
The model needs to be sorted before you move on or you will be continually confused.
Also if there is an issue let’s try break it down one by one. Looking at a model and attempting to understand how to build it just looking at everything is a little tough and very time consuming.
Just get to one problem and try to fix that one first and then move to the next.
I organized so that the fact tables are at the top. Fact Tables Include:
Registrations
Enrollments
Expenses
Completed Courses
Location Actuals
The lookups are:
Student ID
Location Code
In the Student ID table should I actually have a calculation for VLookup? I cant use the Student ID from that table and the location field from the enrollments table to look at the count of Students by state. I think I am missing something and probably should never try to work on this stuff at the end of a long day.
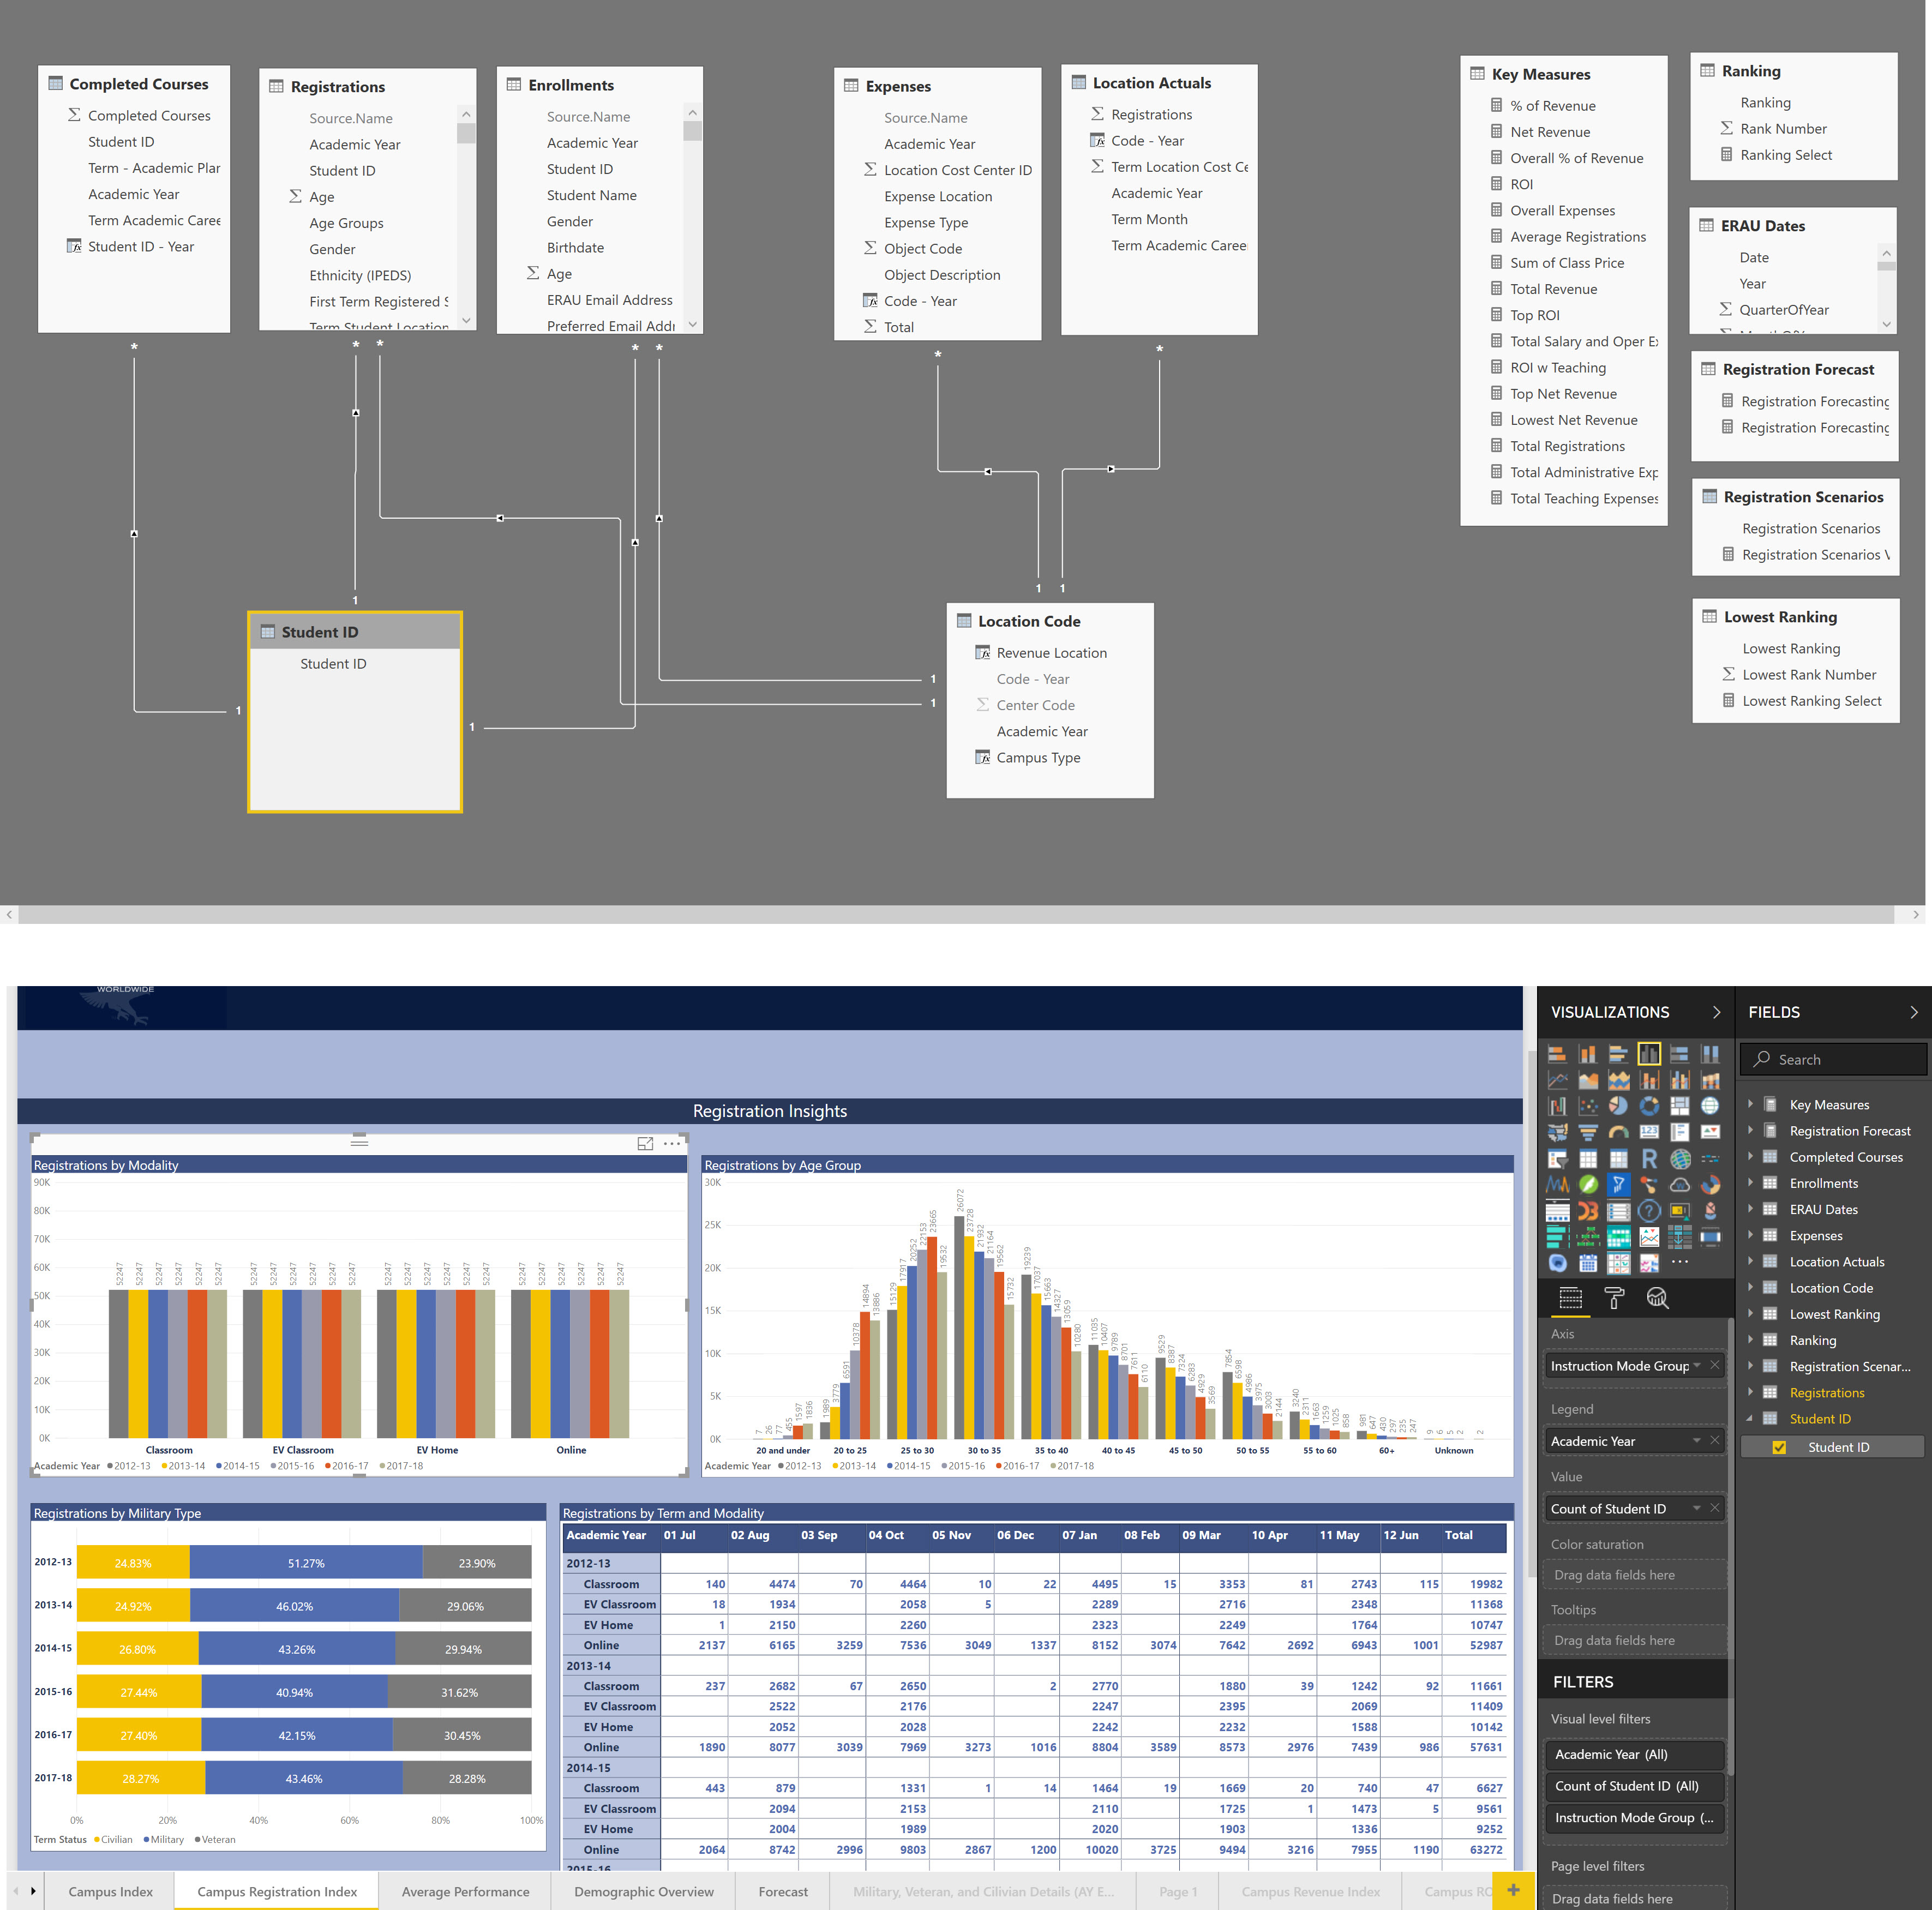
Fixed. Now how do I fix the issue where using the "Student ID"with the Instructional Mode Group and Academic year field from the ‘Registration’ table just makes all the values the same? Thats the only issue I am experiencing.
Anywhere in your table is there an identifier that shows where a student is from?
Which table does that sit in? Currently the student ID only has the student ID, that particular table needs to be expanded to have some location information in there also.
Technically the ‘Enrollment’ table includes those variables. But because its one .csv file with multiple academic years in an academic year column thats why I ended up with it as a fact table. The students repeat in the ‘Enrollment’ table in a single academic year because they go from undergraduate students to graduate students in the same year or add another degree program in the same academic year. All of those are defined in columns.
Saving the PBIX file so that I can upload it. I turned Enrollments into a lookup table by creating a column with a unique code that accounts for the different academic years and the student ID.
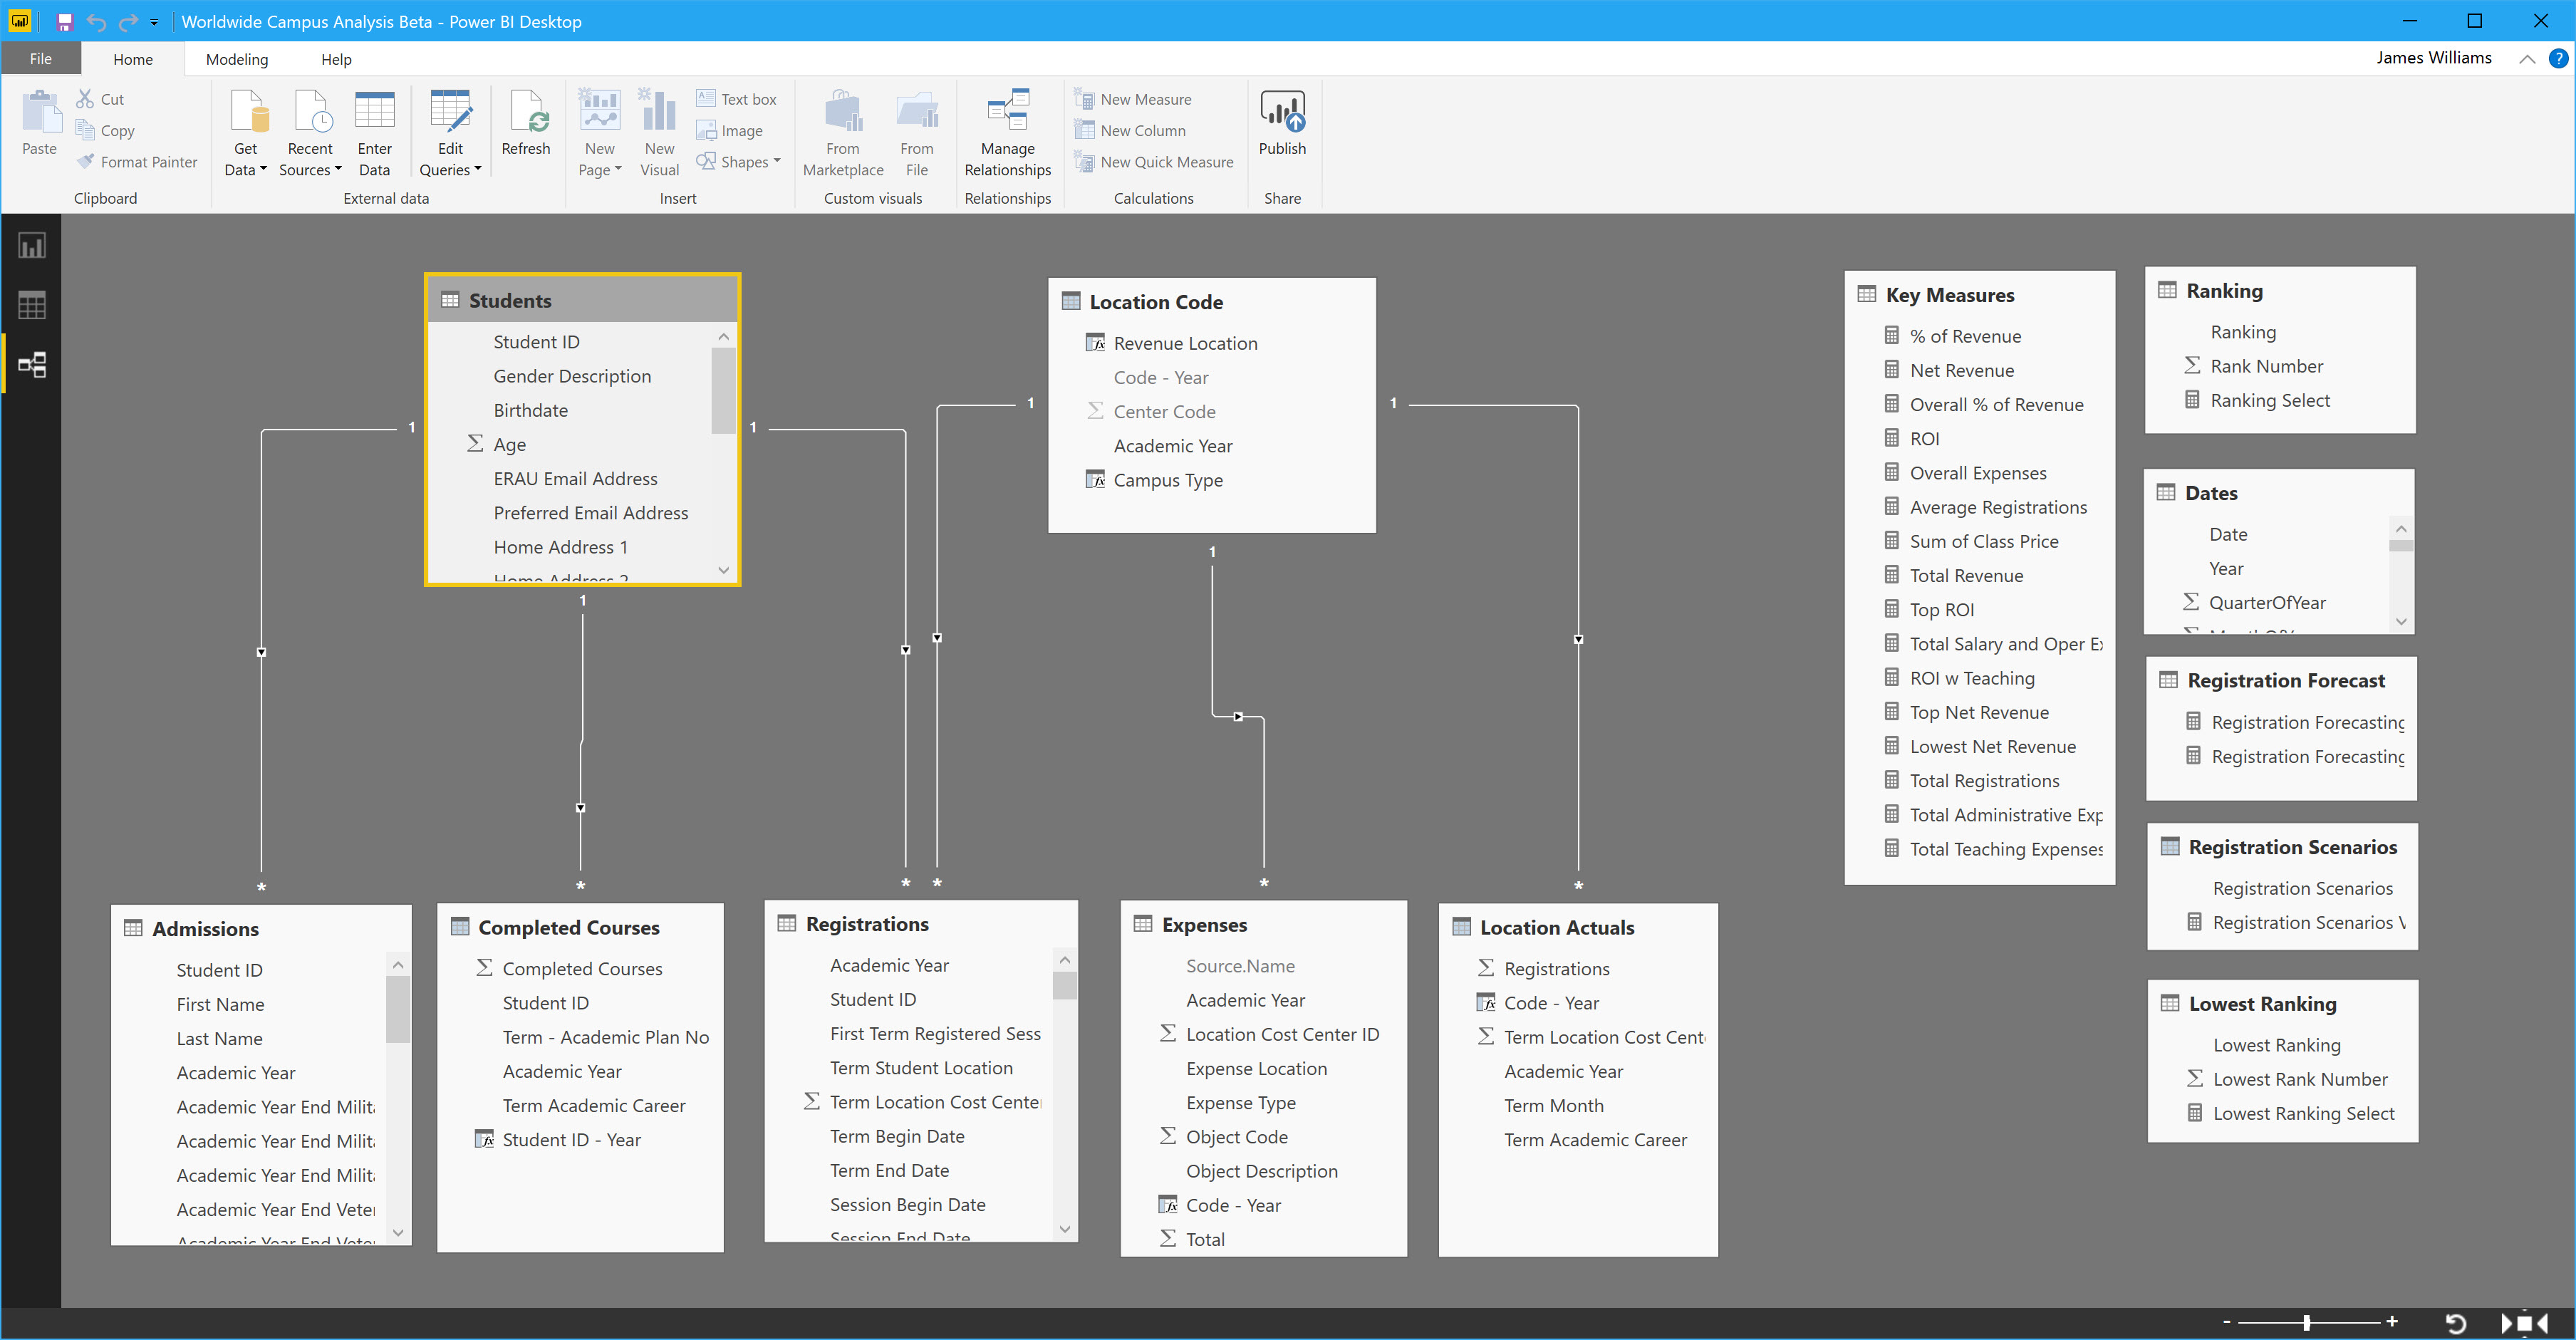
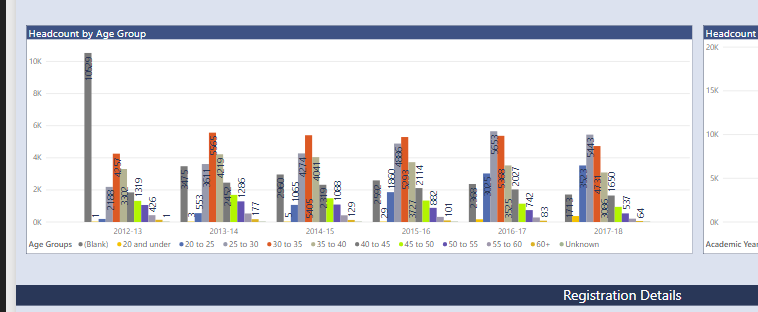
Ok so I did some re-work and renamed the ‘Enrollments’ table to ‘Students’ so that I know this is the actual student (customer) and their demographic information such as age, age group, gender, ethnicity, student ID, physical address. I have connected it as shown in the attached image. The problem is when using a demographic variable such as “Age Group” from the ‘Student’ Table with “Registration Count” from the ‘Registrations’ table it does not show registrations broken down by age group. The tables are connected by the field “Student ID.”
Hi sorry for the late reply I have been traveling. The reason I had to change the Student ID column to text was to keep it from dropping the leading zeros in the students ID number. Do you know of a way to get it to keep the leading zeros when changing to whole numbers?
I am creating a new column to hold the leading zeros using the following, don’t know if there is a better approach/practice.
Student = FORMAT ('Registrations'[Student ID], "0000000")
I am doing this for all the tables that contain ID. Interesting enough the ‘Registrations’ table just let me change the Data Type to Whole Number but the other tables would not.
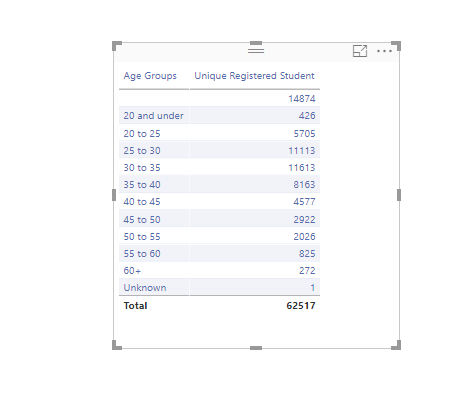
I think I have finally arrived at my last roadblock!!! This is on a similar report to the one I started in this thread but paired down to its simplest form. Both reports suffer from this exact same problem.
I think the answer is between a couple of videos in the EnterpriseDNA library but when going through it and what I have I cannot find why the relationship between the ‘Students’ table is not working with the ‘Completed Courses’ table.
Key Measures created are:
Unique Registered Student
Average Completed Courses
I am trying to take “Completed Courses” and “Academic Year” from the ‘Course Completion’ table and use the key measure “Unique Registered Student.” I took it all a part and tried to find things in the “Advanced Data Transformations and Modeling.” Also tried scanning the forum to see if there was any notes on “If you see X then its likely happening because you have or have not done Y.”
Ok let’s clarify exactly what your asking here, because I’m not sure.
Can you include the formulas please.
What visual are you trying to create?
I’m presuming the measures are calculating over the registrations table, and the filter is coming from course completion table? There’s no relationship between those two table so that’s why it’s likely not filtering.
Thats correct, the measures are calculated using the registration table. Completed Courses and Academic year are coming from the Completion Table. I thought about the relationship aspect but couldn’t figure out how I would establish a relationship between the two tables since neither has unique variables. The Student ID repeats in both tables.
So the table called ‘Course Completion’ is created in Query editor by using the Group By Function to Group first by Student ID then by Academic Year then Academic Career. The column that is created by the Groupings is Completed Courses which is a count of the students completed courses in an academic year by academic career level (undergraduate or graduate).
Initially I had ‘Course Completion’ created as a calculated table using the following but figure it would be better to have it done on the query editor side.
Course Completion = SUMMARIZE('Registrations', 'Registrations'[Student ID], 'Registrations'[Ethnicity (IPEDS)], 'Registrations'[Age Groups], 'Registrations'[Gender Description], 'Registrations'[AY END - Academic Plan No Roll-up], 'Registrations'[Academic Year], 'Registrations'[Academic Year End Academic Career], 'Registrations'[Age], "Completed Courses", COUNTA('Registrations'[Student ID]))
Any of the above items used to summarize are in theory what could be used to view the information based on to make marketing decisions.
Most common would be looking at number of completed courses by:
Age Group
Gender
Academic Year End Academic Career
AY-END - Academic Plan No Roll-up
The measure formula used for “Unique Registered Student” is Unique Registered Student = COUNTROWS(VALUES(Registrations[Student ID]))