I am having issues trying to calculate a value from the previous fiscal year.
The data is a little odd in that last years data is provided at a quarterly level of granularity and this years is monthly.
So the initial calculation takes this into account, and seems to be working fine, but I am having issues with the calculation for the previous financial year. But feel I need an ALL on the filter to change the filter context and bring back the entire data calendar. If using FILTER( ALL( is correct, the syntax is killing me.
I have attached the pbix for download.
Any help would be greatly appreciated. @BrianJ, it is similar to the one you solved for me, I have tried my best,
John
Update: I had the FY start incorrect in the last file
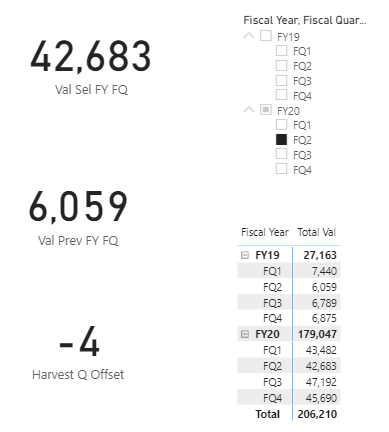
Dealing with mismatched granularities is always tricky, and this one is no exception – much more difficult than the one we worked on yesterday. Per my previous post in the last thread about time intelligence, we made good use here of the quarterly offset in the extended date table. Here’s what I did:
In the slicer that contains fiscal year and fiscal quarter, I harvested the selected quarterly offset
I created a disconnected physical helper table that added the relevant quarterly fields from the date tabl, using the RELATED function. (Note: it would be cleaner to do this as a virtual table variable within the measure in #3 below, but the DAX to do so is significantly more complicated and I thought this would be an easier way to show what was going on in the process).
Created the following measure to filter the summary table above, based on the harvested fiscal quarter minus 4 (i.e., stepping it back four quarters to the same quarter of the previous fiscal year):
One thing I should have mentioned above is that the are two ways to deal with the granularity mismatch:
You can aggregate the higher granularity (months, in this case) up to the level of the lower granularity (quarters, here); or
You can allocate the lower granularity down to the level of the highest.
Which you use will depend on the nature of the problem and the desired outcome. #1 is easier, #2 is more common (most budgeting scenarios fall into the latter).
In the videos above, @sam.mckay goes through his revised methodology for #2 - it’s absolutely worth taking the time to understand that approach to the point that you can construct and apply it yourself, since it’s a common scenario and the tools he provides are generalizable to a lot of different situations.
Thanks Brian. I do understand and will continue to work at it / practice scenarios.
Thank you very much for your support over the last couple of weeks.
Kind regards
John