Okay, think I’ve got a solution for you on this one as well. Let’s start with the totals first, since that ended up being the harder part - once we get that, you’ll see the stages calculation just becomes a drag-and-drop.
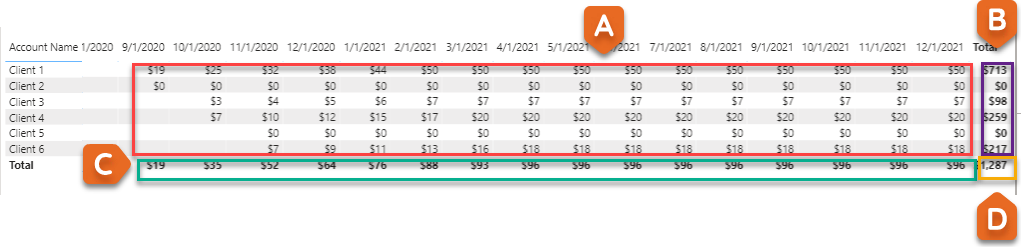
The challenging aspect of correcting totals in a matrix is that you have four different evaluation contexts to deal with and correct. The way I handled this was with a SWITCH(TRUE() ) construct to manage the four different combinations of HASONEVALUE = TRUE/FALSE for the row and column fields of the matrix, using a CROSSJOINed virtual table to simulate the matrix visual structure. It’s a long measure, but if you break it down into the A, B, C and D sections of the visual below, I think the logic is pretty clear, and I’ve added some comments to help you navigate it.
Discounted Monthly Sales w/ Totals by Client =

VAR AllClientDiscount =
LOOKUPVALUE(
    Discounts[Discount],
    Discounts[Offset Threshold],
    0
)

VAR Result =
( [EV Monthly Sales] * AllClientDiscount ) * (1 - [Monthly Discount Lookup] )

VAR FiltResult =
IF(
    SELECTEDVALUE( Dates[FirstDayofMonth] ) <= SELECTEDVALUE( Data[Go Live Date] ),
    BLANK(),
    Result
)

VAR vTable =
CALCULATETABLE(
    ADDCOLUMNS(
        CROSSJOIN(
            VALUES( Data[Account Name] ),
            VALUES( Dates[FirstDayofMonth] )
        ),
        "@DiscMnthlySales", [Discounted Monthly Sales]
    )
)

VAR vTabTotals =
SWITCH( TRUE(),
    // Matrix Cell Values (A)
    AND(
        HASONEVALUE( Dates[FirstDayofMonth] ),
        HASONEVALUE( Data[Account Name] )
        ), FiltResult,
    // Right Side (Row) Totals (B)
    HASONEVALUE( Data[Account Name] ),
        CALCULATE(
            SUMX(
                vTable,
                [@DiscMnthlySales]
            ),
           VALUES(Dates[FirstDayofMonth] )
        ),
    // Bottom (Column) Totals (C)
    HASONEVALUE( Dates[FirstDayofMonth] ),
        CALCULATE(
            SUMX(
                vTable,
                [@DiscMnthlySales]
            ),
           VALUES( Data[Account Name] )
        ),
    // Grand Total (D)
    CALCULATE(
            SUMX(
                vTable,
                [@DiscMnthlySales]
            )
    )
)

RETURN
vTabTotals
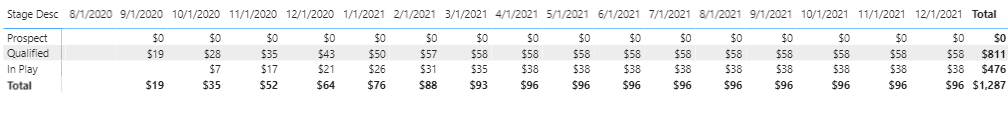
Now that we’ve done the heavy lifting above, redoing the visual by stage simply becomes a matter of dragging and dropping the Stage Description field into the matrix rows well instead of Account Name, and boom!:
I hope this is helpful. Enjoyed working with you on this one – your definition of the problem and examples have been really clear and useful.
Full solution file attached below.
- Brian
P.S. @Greg - I’m looping you in here since this is a pattern we may want to consider adding in the fixing totals DAX pattern section.
eDNA - monthly ramp-up solution2.pbix (115.0 KB)