Hi Team,
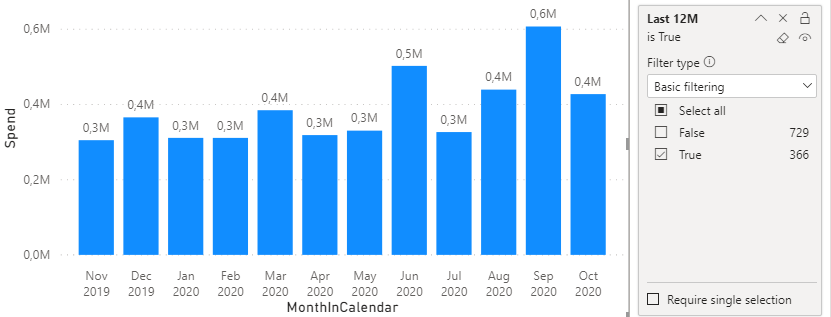
I would like to have a graph taking the data for last 12 months not including current month.
my data are live updated from ERP.
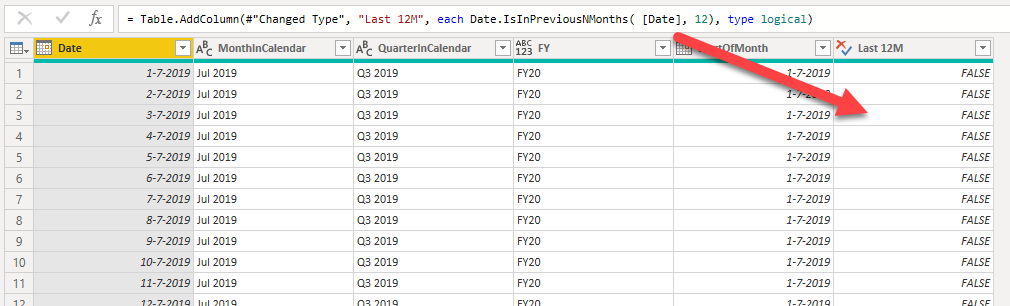
I added a column which can filter for last 12 months not including current month. But I got it from Jul 2019 to Nov 2020. Please see incorrect result sheet.
In the attached, I need Sep 2019 to Oct 2020 as we are now Nov 2020.
Hi Team,
I just want to add a bit more on this. I also require “Last 12 Months and Next 12 months” column and “Last 12 Months + Budget FY 2021” column.
I have attached the date table and expected result highlighted in Yellow. "M code with Power query will be a great help as I am doing manually at the moment.Q12Mths24Mths&12Mths+Bud.xlsx (94.3 KB)
Thank you.