Rolling average DAX question - HR solution

I have a question

I need to do a rolling average and I’m struggling in a Tabular model for PowerBI
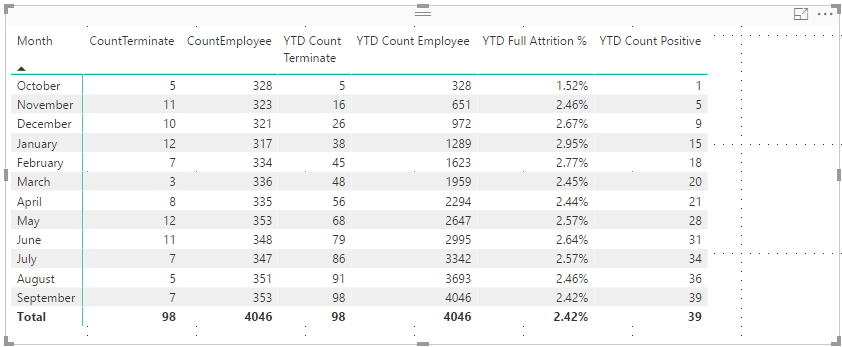
Here is my scenario. It’s a HR solution. YTD count employee needs to be a rolling average. i.e Sum of employee divided by the fiscalmonth number so for November it should be 325.5 then the attrition should be the average employee count divided by the CountTerminate. I’m stuck - I’m lost somewhere in the context etc, I think

This is my calc for YTD Count Employee - Please help me to change that to a rolling average for financial year

    YTD Count Employee:=
    CALCULATE (
        SUM(  'Monthly Snapshot'[CountEmployee] ),
        FILTER (
            ALL ( 'Date' ),
           'Date'[FullDate] <= MAX ( 'Date'[FullDate] )
        )
    )

Hi Nikki, Ok so the formula you have now is the cumulative total pattern (from the beginning of time as you are using the ALL function within FILTER)

Just for a review of the different in cumulative total patterns see here in the Solving Analytical Scenarios module - http://portal.enterprisedna.co/p/solving-business-scenarios-with-power-bi-and-dax

For the Rolling average you will want to use a formula like I describe in this video -

Let me know if this solve it for you.

Hi
I managed to get a solution using your videos and some gymnastics
:woman_cartwheeling::man_cartwheeling:

so this gave a cumulative average of the monthly employee count
I created a separate column from the date in the employee snapshot table called MonthNumber, then did a distinct count of all selected dates to use in the calc, so that I would get the number of months so far for the financial year

Average Employee Count YTD:=
CALCULATE (
    DIVIDE (
        SUM ( 'Monthly Snapshot'[CountEmployee] ),
        DISTINCTCOUNT ( 'Monthly Snapshot'[MonthNumber] )
    ),
    FILTER ( ALLSELECTED ( 'Date' ), 'Date'[FullDate] <= MAX ( 'Date'[FullDate] ) )
)

Then I created a cumulative count for terminated staff

Cumulative Terminate Count YTD:=
CALCULATE (
    SUM ( 'Monthly Snapshot'[CountTerminate] ),
    FILTER (
        ALL ( 'Date' ),
       'Date'[FullDate] <= MAX ( 'Date'[FullDate] )
    )
)

and then the cumulative percentage. This sa figure that only the user understands but at least they do :stuck_out_tongue_winking_eye:

Average Terminate YTD:=
[Cumulative Terminate Count YTD]/[Average Employee Count YTD]

Ok that’s great. Only thing to remember is that with this formula

Cumulative Terminate Count YTD:=
CALCULATE (
   SUM ( ‘Monthly Snapshot’[CountTerminate] ),
         FILTER (  **ALL ( ‘Date’ ),**
          ‘Date’[FullDate] <= MAX ( ‘Date’[FullDate] )))

The ALL function is going back to the very first date of you date table and data regardless of the time frame you have selected. Just something to consider