All I can say is it’s probably to do with the alignment of dates.
The months you are calculating in excel are probably not the same as in Power BI
Number of Sales over time =
// Calculate timeframe for leavers. Previous year backdated by number of years selected
VAR StartDate = DATE(YEAR(TODAY())-[Back Year Selection],1,1)
VAR EndDate = DATE(YEAR(TODAY())-1,12,31)
VAR DateRange =
    FILTER(
        ALL(Dates),
        Dates[Date] >= StartDate
            && Dates[Date] <= EndDate
    )

RETURN
CALCULATE(
    DISTINCTCOUNT(Sales[Salesman ID]),
    DateRange,
    VALUES(Dates[Month Of Year]) // Bring the months back into the equation
)
Have you check they are looking at exactly the same date range as you have in this formula?
Power BI is just calculating up the data context it is given. So that’s really all that could be different in this case in my view.
Hi,
If I am right, then Power BI should be calculating from 2018-3, ie 1/1/2015 - 31/12/2017
Excel is filtering the years 2015, 2016, 2017
They are identical.
The actual matrix data is the same, just not the total lines. This is where the error is creeping in.
I agree that’s the date range.
Could it be that excel maybe is incorrect and Power BI is right.
I can’t see any reason why Power BI would be incorrect at the moment.
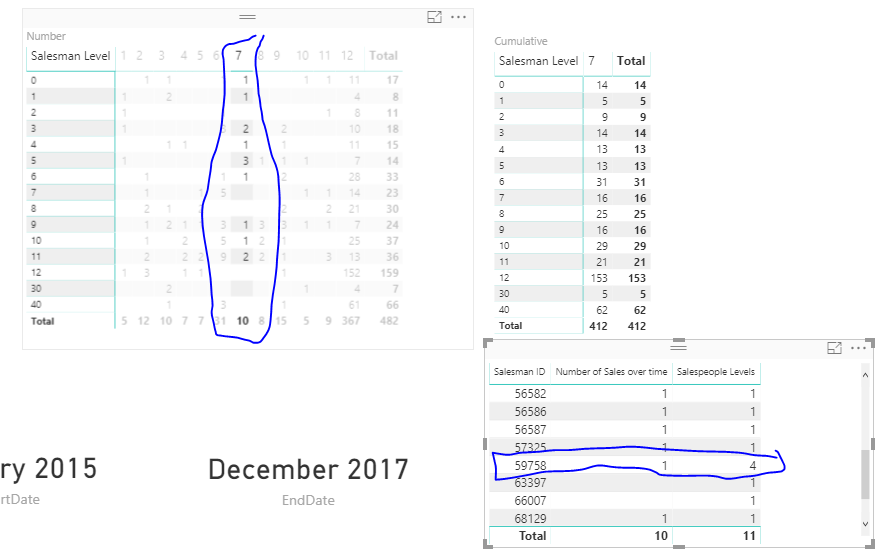
The reason the total could be different to the individual values in the matrix is because the total is looking at the entire month and saying (in July ) that across this one month over the past 3 years there has been 10 unique salespeople.
The amount within the matrix could be different because within each level there could be unique salespeople but they maybe are reference across multiple levels.
You seen here it actually seems to be the case.
This particular ID is reference across 4 different levels.
That’s why the total are different in Power BI. I would go as far to say Power BI is more technically correct here.
Attached
Testing Reverse Cumulative (2).pbix (301.9 KB)