Retrieving Rows Based From Multiple Tables as Names Inside Column

Dear All ,
We Have 3 Tables, MainTable , ContactBill and Contractpayment.

The Fields Inside Main Table as the following:

ID: Integer Primary Key
Amount: Double, Amount in US$
Code: Text Represents the name of the related table either (ContactBill or Contractpayment)

Related Tables:
ContactBill

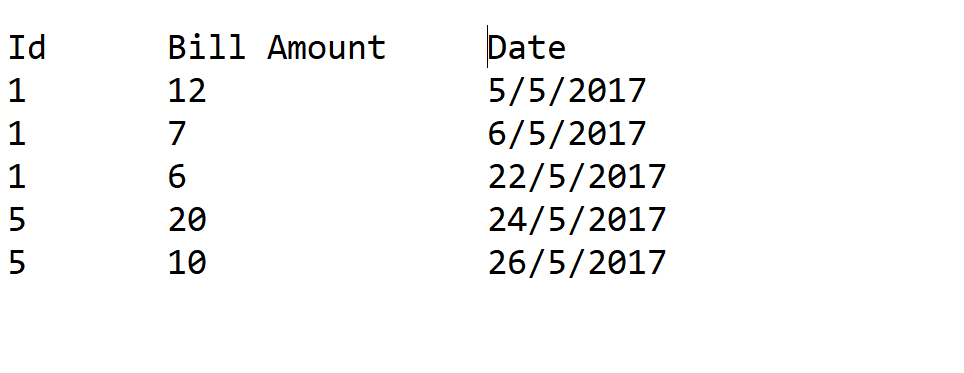
The Fields Inside ContactBill (Payment Installments By Bills) Table as the following:
ID: Foreign Key Reference (MainTable)
Amount: Double, Amount in US$, this represents the Installments of payments based on (Bills).
For example: In the main table the amount is (10) then In ContactBill it might be in a form of Installments (5,5) in two rows of the table For particular ID.
Date: Installment Date where the amount paid.

Contractpayment

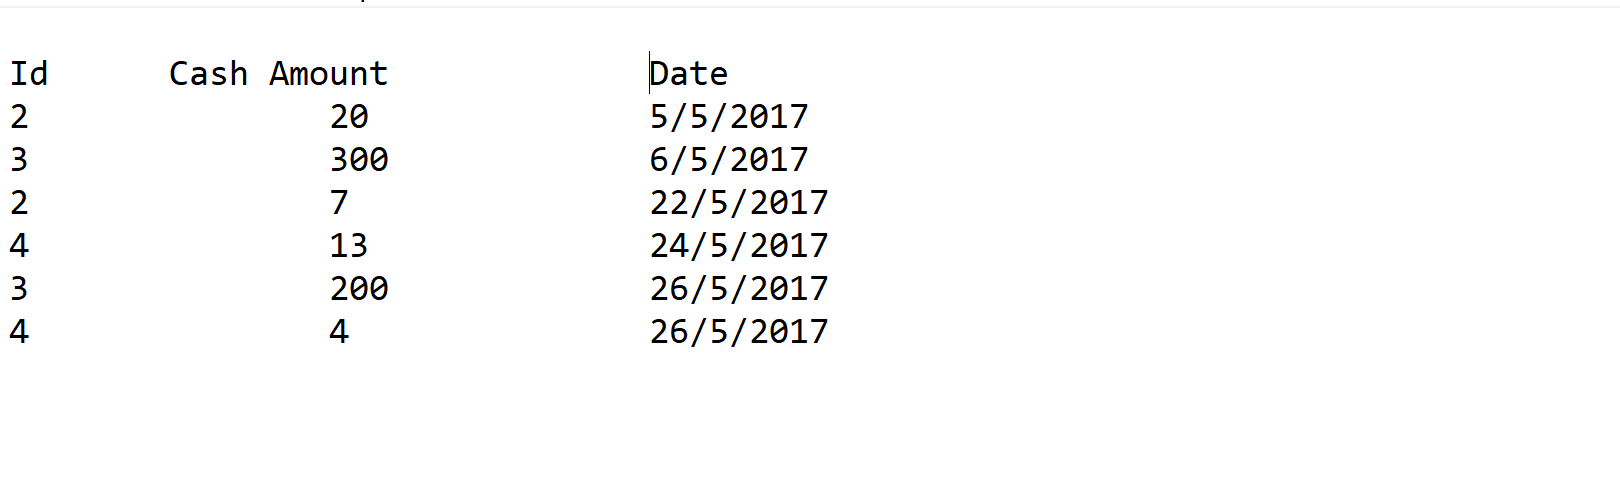
The Fields Inside Contractpayment (Payment Installments By Cash) Table as the following:
ID: Foreign Key Reference (MainTable)
Amount: Double, Amount in US$, this represents the Installments of payments based on (Cash).
For example: In the main table the amount is (12) then In ContactBill it might be in a form of Installments (8,4) in two rows of the table For particular ID.
Date: Installment Date where the amount paid.

How can I implement DAX to do the following 2 Tasks:

1-Based On the code from MainTable Lists all the Installments for this particular code with the ID.
Example:
Code(ContactBill) and ID (1), will list all the Installment amounts In the table (ContactBill) with ID (1) including its dates. In this list table, we must take into account to display the column name for each table( Cash Amount (ContactPayment), Bill Amount (ContactBill)).

2-If there is a difference between the Total Amount in (Main Table) and the sum of Installments of their Related Tables (Codes) it should calculate this difference, Example: In Main Table ID=4 has amount=26 for Code (ContactPayment) , In Table ContactPayment ID=4 have two rows (13,4) = 17 , But the amount in main table = 26 , means the Difference Should be: 26-17= 9.

Thank You

Note: In spite that the 2 related tables looked as the same structure, but for some reason, we must deal with them separately Because In the near future any or both of them might have different fields column , In Addition it should be without physical relationship with (Main Table).

I’m really sorry I can’t imagine everything you’ve written here, it’s just too difficult.

Can we mock up a proper model inside of Power BI with the correct relationships, then look to attempt to work out the formula and we can start from there.

Trying to work out every naunce of the model, DAX formula, the context you want to show this in is just way too difficult when explaining it like this.

Thanks
Sam

Do You Means The Details of the question is not clear?

Ok Simply how can I bring records from Unrelated table based on similar data (common between them) , this is the whole summary

Sure No problem

I’ve read the post 3 times, and trying to imagine every part of the detail around the model to then get you the correct answer is just too hard.

Needs images and then to see where your at with your current formula/s. Then we can iterate from there.

To do this you need to use LOOKUPVALUE.

You don’t need relationships with this formula. You can just match details in different tables and find the data you want. Kind of link VLOOKUP in excel.

Do You Have Any Lookup example in Enterprise DNA?

Check out this one - https://www.youtube.com/watch?v=4dosxfNxR6M

You don’t need the relationship though as per shown in the tutorial. It works fine without it.

Thanks sam

Ok It could solve the problem using lookup, but I don’t need it as (SUMX) I want to display the records Instead of (SumX) how I can do that (Display) ?

Ok , We can make it using switch , but how can we display the records based on the value of the Selected Id?

e.g.:
Code=ContactBill , selected Id= 7 , bring the records of the particular ID from ContactBill Table.
Code=ContactPayment, selected Id= 4 , bring the records of the particular ID from ContactPayment Table.

So there are many records for each Code and Selected ID?

Why do you feel you need a formula for this. Why can’t you setup the model so the your can just use those as filters and then all the records will show after that?

There no way to return a table of data within a measure per say.

You can do some within a table function though, but I’m just not sure you need this. You model should be doing all the hard work here with the filtering.

An example from your Youtube Link:

Total Sales (selected currency) = SWITCH(TRUE(),
[Selected currency]="EUR", FORMAT([Total sales (sek)]*VALUES('Currency'[Currency Rate]),"€0,00"),
[Selected currency]="USD", FORMAT([Total sales (sek)]*VALUES('Currency'[Currency Rate]),"$0,00"),
FORMAT([Total sales (sek)],"0,00kr"))

I need to bring the data = Code of the Table from the Table correspond to it how I can do that using switch?

E.g.
If code=ContactBill select all records from table (ContactBill) with Id = 7
If code=ContactPyment select all records from table (ContactPyment) with Id = 11

The Id might be displayed in (Slicer) or table

The User Will Input (2) things from any Custom Visual e.g.: Slicer (Code) and Table (For the ID)
Based on the above inputs we will look for the Table name and the Id Number to bring the records.

It sounds like you really need to create you model in a way so this filtering happens naturally.

From what I’m understanding you’re trying to bring in a number of records with a formula/measure. This isn’t possible.

To get a range of value based on filter being input into either slicers or from the context generate from dimension in table, the only way you can do this is via the model first, then maybe some aggregated value second via a measure.

You can’t just bring in a list of value from one measure.

I think we really need some images here of the model, to work up from that.

The best thing to do always when looking to work these things out is to start with the model, attempt to get the values you need using some of the techniques I showcase, then we can build up from there.

Chrs

Thank You, Sam , I have a solution and I would like to share it with you :slight_smile:
1-Create New Lookup Table e.g. (CombinedTable) With Code Values (ContactPayment,ContactBill).
2-Append The Rows of Both Tables (ContactPayment, ContactBill) and create new Table (ApTable) Including All their original columns from both tables.
3-Create m:m relationship between :
MainTable m:1 (CombinedTable) and ApTable m:1 (CombinedTable)
4-Then Do conditional column inside (ApTable) to display the proper columns with the proper calculation fit with each table.

Thank you so much again

Yes nice, this sounds like a very good solution for this, versus something measure related.

It always start with a solid model. It make your life much easier on the front end to get the visual you want/need.