Reporting Date , Exit Date , Join Date

Hi There , I work with a disability employment provider .

I have a report showing Report Date - which i have connected to date table.

Join Date which 90% falls in the reporting months , however some are falling in Future due to funding approval .

and exit date which can be any month depends on processing time. .

I am having difficulty because reporting date is difference from exit date.

@Aree ,

It’s difficult to diagnose specifically what the problem is here without seeing your data model, PBIX file or a mockup of the results you want to see. However, based on information provided I think these two videos may be helpful to you.

– Brian

Cohort Data.pbix (82.9 KB)
Cohort Data.xlsx (1.1 MB)

Hi Excel Table1 in Sheet1 , is what i am trying to replicate .

I am trying to get the drop rate . in power bi

Thank you .

Bumping this post for more visibility.

@Aree,

Thanks very much for providing the data. I apologize for the slow response – I’ve been largely consumed this week getting the new Power BI Accelerator initiative rolling. Will dig into this today and hopefully have a solution back to you by this evening.

  • Brian

@Aree ,

This required a complete end-to-end approach. Here are the steps I took:

  1. added the Extended Date Table to the model, and marked it as a date table

  2. created the active and inactive relationships between the date table and the fact table to account for the three different dates

  3. created the DAX measures below

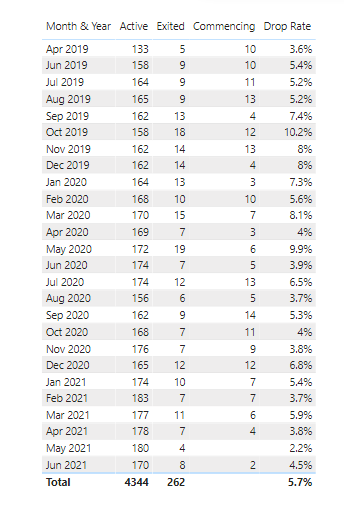
  4. dropped the measures into the table below

     Active Customers =
         CALCULATE( COUNTROWS( 'Data' ), 'Data'[Customer Status] = "Active" )
    
     Commencing Customers =
         VAR SelYr =
             SELECTEDVALUE( 'Dates'[Year] )
         VAR SelMo =
             SELECTEDVALUE( 'Dates'[MonthOfYear] )
         VAR Result =
             CALCULATE(
                 COUNTROWS( 'Data' ),
                 FILTER(
                     ALLSELECTED( 'Data' ),
                     YEAR( 'Data'[Extract_Date] ) = SelYr
                         && MONTH( 'Data'[Extract_Date] ) = SelMo
                         && YEAR( 'Data'[Commencement_Date] ) = SelYr
                         && MONTH( 'Data'[Commencement_Date] ) = SelMo
                         && 'Data'[Placement_Sequence_Number] = 1
                 )
             )
         RETURN
             Result
    
     Exited Customers =
         CALCULATE( COUNTROWS( 'Data' ), 'Data'[Customer Status] = "Exited" )
    
     Drop Rate =
         DIVIDE( [Exited Customers], [Exited Customers] + [Active Customers], BLANK() )
    

Here’s what it looks like all put together:

I would strongly recommend going through the courses below, as they cover all the concepts I have utilized above in this solution.

I hope this is helpful. Full solution file attached.

1 Like

Hi @Aree , did the response provided by @BrianJ help you solve your query?

If not, how far did you get and what kind of help you need further?

If yes, kindly mark as solution the answer that solved your query.

Hi @Aree, we’ve noticed that no response has been received from you since the 22nd of June. We just want to check if you still need further help with this post? In case there won’t be any activity on it in the next few days, we’ll be tagging this post as Solved.

Hi @Aree, due to inactivity, a response on this post has been tagged as “Solution”. If you have a follow question or concern related to this topic, please remove the Solution tag first by clicking the three dots beside Reply and then untick the check box.