Remove selectedvalue/slicer impact

Hi,

I have built the following dashboard based on player statistics. The filter context is driven by Club, player and year. From these slicers I have a range of KPIs for a specific player in any given year.

However, in the bottom right I am trying to build a chart that highlights a particular KPI for everyyear of that players career. What I am trying to achieve is shown in the chart below the main visualisation.

What I am struggling to do, is to build a mesaure that in effect disconnects the Season slicer, that is remove the impact of selectedvalue in the Season, but leave in place the overall season filter.

Thank you

MIchael Gordon

AFL.pbix (511.3 KB)

@MIchaelGordon,

Very nice report. I particularly like your application of the chiclet slicer.

Is this the effect you’re looking for:

If so, just two straightforward changes needed:

  1. in the edit interactions option, turn off the interaction between that slicer and the column chart visual:

  1. then change your DAX measure from ALL to ALLEXCEPT:

    Career Games =

      CALCULATE(
          [GamesPlayed],
         ALLEXCEPT(
             PlayerData,
             PlayerData[Season]
         )
     )
    

I hope this is helpful.

  • Brian

HI Brian

Thanks for your reponse. I had tried both, but not together. I have now tried your solution but I am not getting the result. Here is the view. Am I missing something?

Cheers
Michael Gorodn

@MIchaelGordon,

That’s weird – it looks like you applied both steps correctly but are getting a different result. Let’s swap PBIX files to figure out what’s different.

  • Brian

eDNA Forum - AFL Ignore Slicer Solution.pbix (511.4 KB)

Hi Brian

My file is attached, but there appears to be another problem in that the data in the solution chart is odd and does not reflect the games played in any one year by this player. The number looks to be a total of all players.

Have a look on page 1 of the attached file for the games played each year for each player. In this case in the Melbourne team. You can easily match up the player on the front page.

I appreciate your help, thank you.

Michael Gordon
AFL.pbix (511.4 KB)

@MIchaelGordon,

OK, clear what’s going on now. In the column chart, you had no field in the Axis well, so it had no context for Season to draw from in the measure.

In my revised solution below, I made a few changes:

  1. Replaced the table with a player slicer in the top left, and added a card for career games. For what you want to do, filtering via the table isn’t going to work. FYI - if you want to replicate the look of the table with a slicer that also shows career games, you can use the new version of SmartFilterPro to do so.

  2. Created a Harvest Player measure to make clear when one player has/hasn’t been selected. When no player is selected from the slicer, the card will read “Please select a single player” and the measure will sum career games over the whole team by season.

  3. Revised my measure to return the filters on player and team, as well as season:

    Career Games =

     CALCULATE(
         SUM( PlayerData[Games] ),
         ALLEXCEPT(
             PlayerData,
             PlayerData[Player], PlayerData[Team], PlayerData[Season]
         )
     )
    

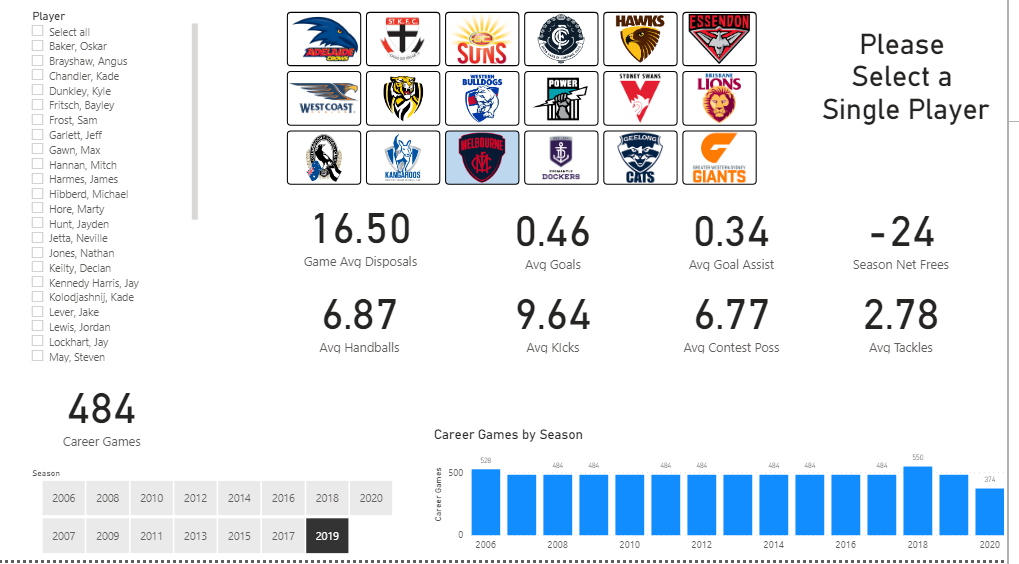
Here’s what the page now looks like with no player selected:

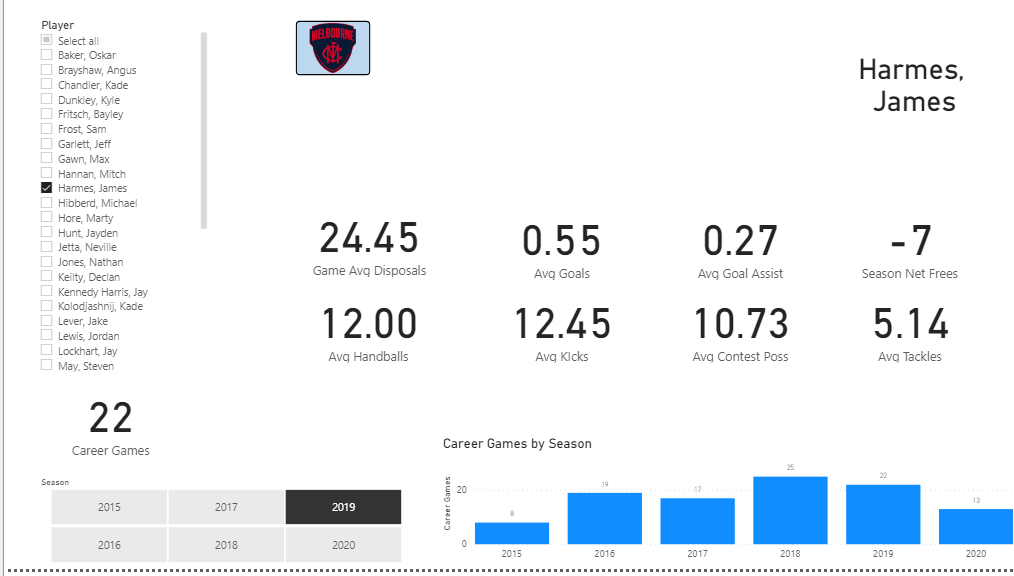
and with a player selected:

I hope this is helpful. Revised solution file listed below.

Brian, Billiant, thank you very much.

The learning curve is steep and not much is intuitive. I am doing a lot of reading ( particualrly Russo and Ferrari) as well as courses but it is taking a lot of practice to bring the elements together and to work out what goes with what. It’s a whole new thinking process but slowly making progress.

Thanks again

Michael Gordon

@MIchaelGordon,

Great – glad that hit the mark for you. My experience is that the learning curve feels really steep, and for a while you won’t feel like you’re making much progress and suddenly bang! – things suddenly will click into place and you’ll take a big leap forward.

The Enterprise DNA content augmented with Russo and Ferrari Is a great way to proceed. I’m also a huge believer in the power of structured practice to reinforce that learning. Doing things like building your football report are perfect ways to do that. Here’s a video that you also may find helpful in that regard.

Good luck with your Power BI/DAX journey, and just give a shout if you run into any more questions.

  • Briann