I am ranking by 2 Measures - Average Invoice Value Group Ranking and Average Net Sales Group Ranking and Summing them that gives me a monthly Ranking Total for each Group Restructure.
All that is fine but I am struggling to add those Monthly Ranking Totals together to give me a YTD Overall Ranking Total for each Group.
Simple 3 Table Model with FactSales, Calendar and Location. With FactSales relating to Location via a LocationID.
Any help would be welcome.
Average Invoice Value Group Ranking =
IF (
HASONEVALUE( Branch[Group Restructure] ),
RANKX (
ALL ( Branch[Group Restructure] ),
[Average Invoice Value]
),
BLANK ()
)
Average Net Sales Group Ranking =
IF (
HASONEVALUE( Branch[Group Restructure] ),
RANKX (
ALL ( Branch[Group Restructure] ),
[Average Net Sales Per Branch]
),
BLANK ()
)
Total Group Ranking = [Average Net Sales Group Ranking] + [Average Invoice Value Group Ranking]
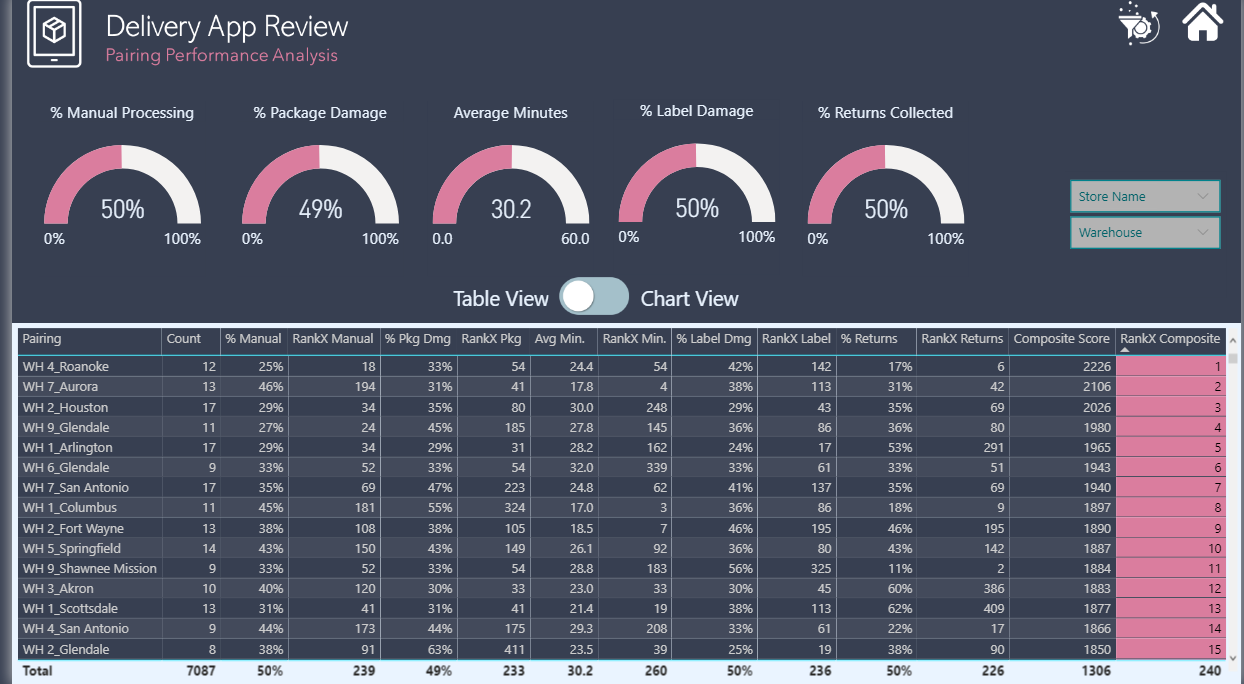
One other thing you may find helpful is my Data Challenge #4 entry. On the report page screenshot below, I created a composite ranking index approach composed of five other rankings. Explanation in the thread below, along with my PBIX where you can go through all the relevant measures, etc.
That is what I want and what I have but I want an added extra of being to be able to sum the Monthly Composite Scores to have a Yearly or To Date Composite Score depending on the Date Selection.
That should be pretty straightforward to implement - basically just changing the ALL functions in the component and composite ranking measures to ALLSELECTED to make the calculations responsive to the selections in your date slicer.
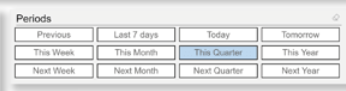
If you really want to polish this up and provide a range of pre-specified period options in your date slicer, you could implement this technique. To see it in action, check out @greg’s entry for Data Challenge #5.
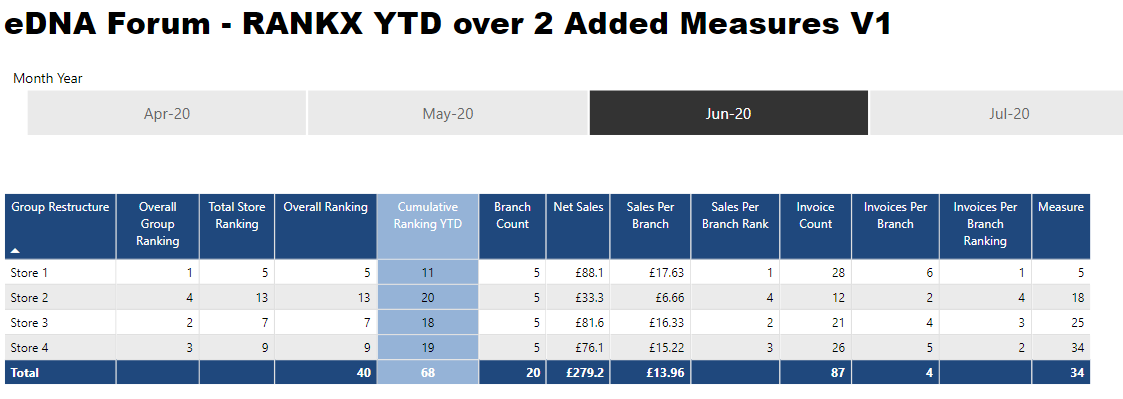
There are 2 Grids, the Top Grid is for April-20 and ranks 4 Categories and then gives an Overall Ranking. The bottom grid gives the Overall Ranking over time. I want to add an extra column the to the top grid that gives the Overall Ranking points summed Monthly for YTD.
I have also noticed the Issue with the Totalled Ranking Points in the bottom grid and I am having trouble understanding what is going on.
You will also notice from the measures that the Financial Year Starts on May 1st.
Hope this makes sense and thank you for your help.
Hi @chris.turnbull. I’m starting on your post, but am presented with the “Apply Changes” bar as soon as I open your PBIX … can you please Apply the Changes then repost the PBIX? Thanks, Greg
Also @chris.turnbull, I think I’m clear on what you’re looking for, but could you please as well mock-up in Excel exactly the outcome you’re looking for while you’re at it? I don’t want to unnecessarily “spin-your-wheels” if I don’t have to. Thanks, Greg
Thanks for looking at this I simply want a measure that gives me the Cumulative Overall Ranking Figure.
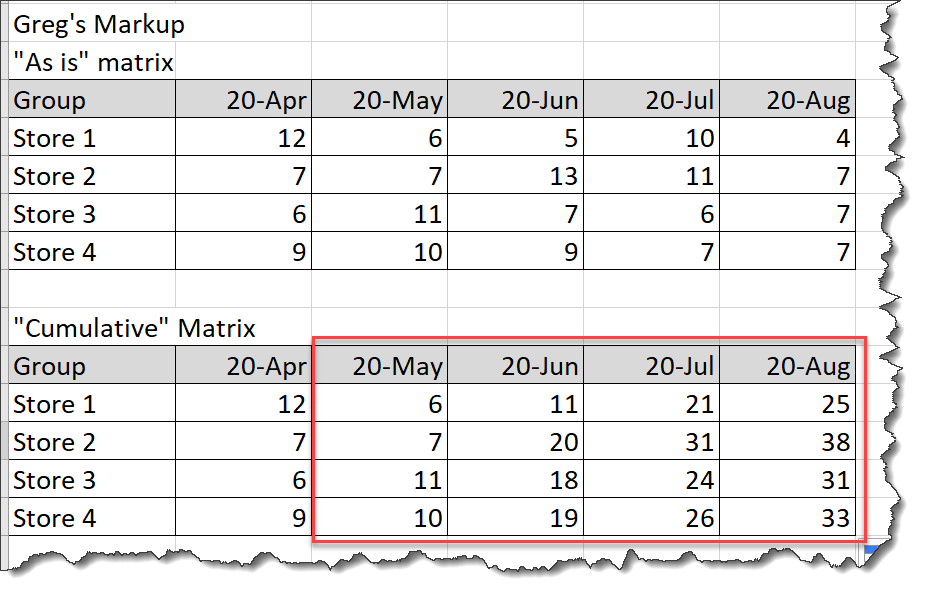
eg. If I am showing the Top Grid in the pbix for July -20. I would want to sum the Ranking Points for May, June and July to give me the Overall Total for my Finacial YTD which starts on May 1st.
So if Store 1 had 5 points for May, 2 for June and 3 for July the YTD Total would be 10.
Hi @chris.turnbull. Are you looking for the cumulative totals from the beginning of time or should they reset to zero at the start or each fiscal year (i.e., omit the Apr-20 numbers in your example)? (Not there yet, but caught this during my initial setup…)
Here’s my markup of the Excel with a possible cumulative matrix: is this what you’re looking for?
Well, I’ve made some progress on your issue but am getting stuck in an virtual table-evaluation context hole and am “spinning-my-wheels”. The solution isn’t dropping-out for me, and I’ve attached my work-in-progress so hopefully one of the other forum members can see an easy fix.
Cumulative Ranking YTD =
VAR _CurrentFiscalYear = SELECTEDVALUE( 'Calendar'[Fiscal Year] )
VAR _CurrentFiscalPeriod = SELECTEDVALUE( 'Calendar'[Fiscal Period] )
VAR _vTable =
ADDCOLUMNS(
CALCULATETABLE(
    CROSSJOIN(
        VALUES( Branch[Group Restructure] ),
        VALUES( 'Calendar'[Month Year] ) ),                     -- this is the line that is causing the issue, in that its filtering for the current [Month Year]
        --ALLSELECTED( 'Calendar'[Month Year] ) ),              -- gives the same values as VALUES
        --ALL( 'Calendar'[Month Year] ) ),                      -- not correct
        --ALLEXCEPT( 'Calendar', 'Calendar'[Month Year] ) ),    -- not correct
	FILTER( 'Calendar',
	    'Calendar'[Fiscal Year] = _CurrentFiscalYear &&
		'Calendar'[Fiscal Period] <= _CurrentFiscalPeriod
		)
	),
	"@Ranking", [Overall Ranking]
	)
VAR _Result =
SUMX(
    _vTable,
    [@Ranking]
)

RETURN
    _Result
I’ll keep trying and will post again if I find anything.
@Greg I think you should use ALL ( ‘Calendar’ ) that way CROSSJOIN will return a combination of visible Branch[Group Restructure] and all of the Calendar[Month Year]
Hi @AntrikshSharma. Thanks for the solution. Could you please attach your PBIX? (as I wasn’t able to get your formula to work for me; its providing a cumulative total across stores rather than across months, whereas your screenshot looks correct …) Thanks, Greg
Awesome @AntrikshSharma … thanks for the review/solution. Grr! Doh! I knew it was something small that was eluding me. @chris.turnbull, here’s the (now) working measure:
 Doh! I knew it was something small that was eluding me.