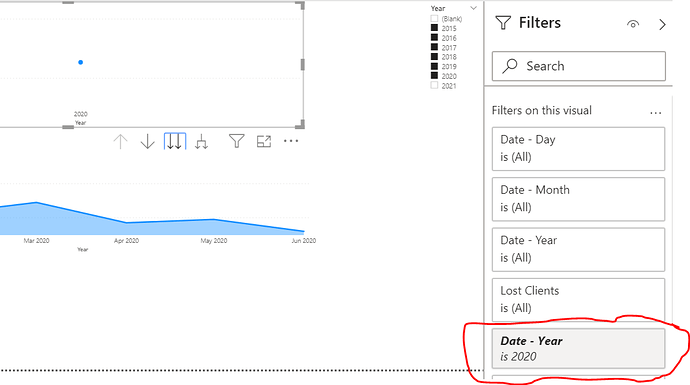
Is it just me or is the date filtering in the Reporting really tricky? I have to be soo careful when clicking on my visuals not to mis-click or somehow I’m drilled into that particular axis value and have no idea how to get out of it. For example, I was working on an Area Chart today and mis-clicked so now I’m stuck in 2020 and don’t know how to get out of it. Somehow 2020 is showing up as a focal point and I have no idea how to clear the filter. I’m sure it’s something simple. Help! Screenshot attached.
Argh. This happens to me all the time. Try clicking on the blue point, and then clicking on it again if necessary which should clear the filter.
To avoid the game of “find the clicked filter” I usually put a button like this somewhere on my report page and tie it to a bookmark that captures the initial desired state of my report. That way, I can always click it to reset back to the initial condition. I know there is now a way to do this within the service, but I like the control of having the reset right on my own report.
I hope this is helpful.
– Brian

1 Like
