Hello Everyone
I am looking to get all months between min and max dates for a product to display on a stacked bar chart.
For example
if Product A is selected in the slicer it should show me Jan, Feb, Mar and April. Feb as it is blank should have status of the preceding month, in this example - Ordered.
if Product B is selected in the slicer, it should show me Jan, Feb and Mar. Feb as it is blank should have preceding status, in this example - Shipped.
Blockquote
This is my data and I have this set up in the attached pbix with a date table
Product Status.pbix (42.1 KB)
| Product |
Status |
Date |
Hierarchy |
| A |
Ordered |
1/1/2020 |
1 |
| A |
Shipped |
3/2/2020 |
2 |
| A |
Delivered |
4/6/2020 |
3 |
| A |
Returned |
|
4 |
| B |
Ordered |
1/3/2020 |
1 |
| B |
Shipped |
1/6/2020 |
2 |
| B |
Delivered |
3/16/2020 |
3 |
| B |
Returned |
3/17/2020 |
4 |
Blockquote
Hi Satichun
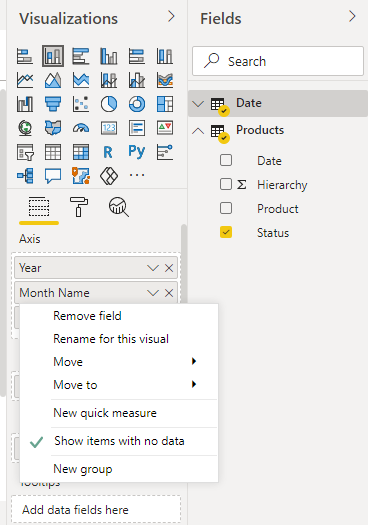
I have tried something, see if it works for you:
I clicked on Month and selected show blank values, after that I can see even the months with no values.
You can see in the screenshot below:
Kind Regards
Shumaila
Hi Shumaila - Thank you for looking and no. The blank February should show January’s status. When the month is a blank it should pick up its preceding status.
For that I think we need to create a measure where we define if month is blank, give the value of proceeding month.
Let me try
I tired several variations and could not get to it.
Hello @satichun, due to the length by which this post has been active, we are tagging it as Solved. For further questions related to this post, please make a new thread. When starting a new post, I suggest linking this thread, provide as much context to a question as possible and include the masked demo pbix file, images of the entire scenario you are dealing with, screenshot of the data model, details of how you want to visualize a result, and any other supporting links and details. Thanks!