Product Gains & Losses Over Time

Hi All

I’m after some guidance on how to measure product gains & losses over time - I’ve realized that it’s more complex than I thought!

We capture whether products exist on customer premises based on a visit to the customer by a sales rep. Customers can also place an order during the rep visit. I need to be able to identify which of these products were gained or lost over time by customer and product.

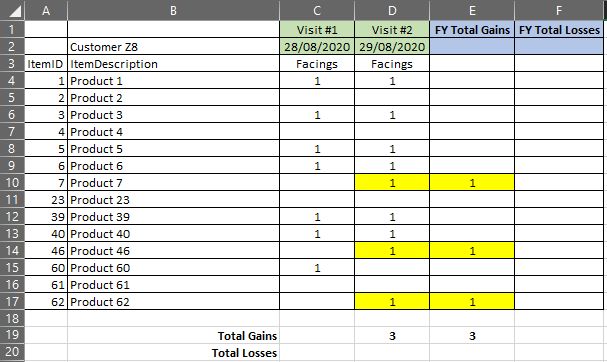
Here’s a sample of a typical timeline.

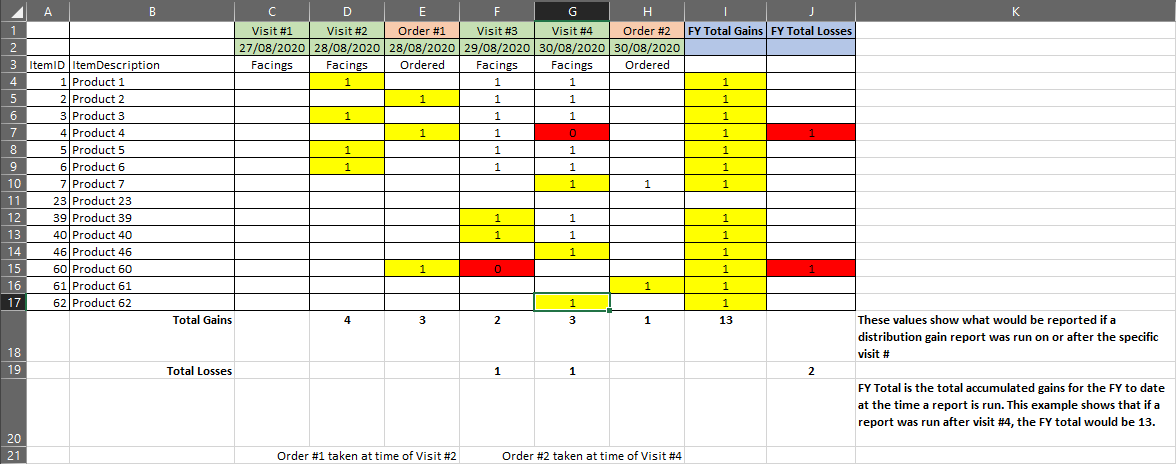
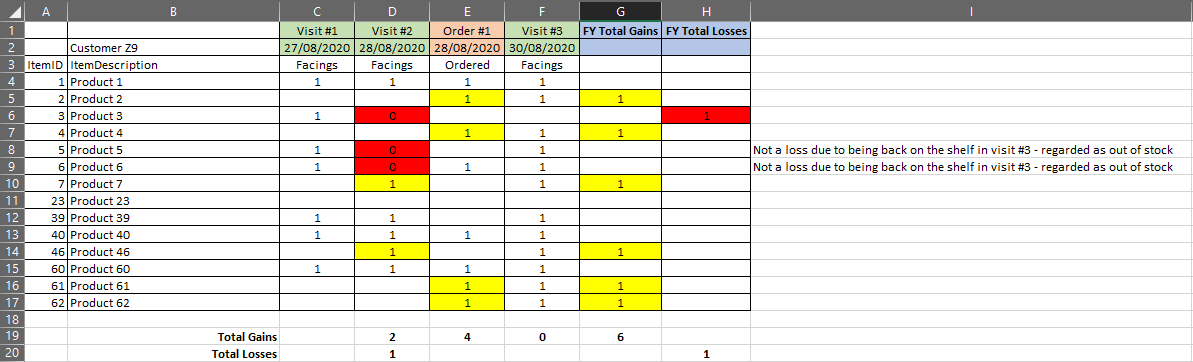
  1. The yellow cells indicate a gained product. If an originally gain product appears in subsequent visits it is not counted again.
  2. The red cells indicate a lost product.
  3. Note: if a product is lost but the next visit shows it present again, the previous loss is regarded as a temporary out of stock - not another gain.

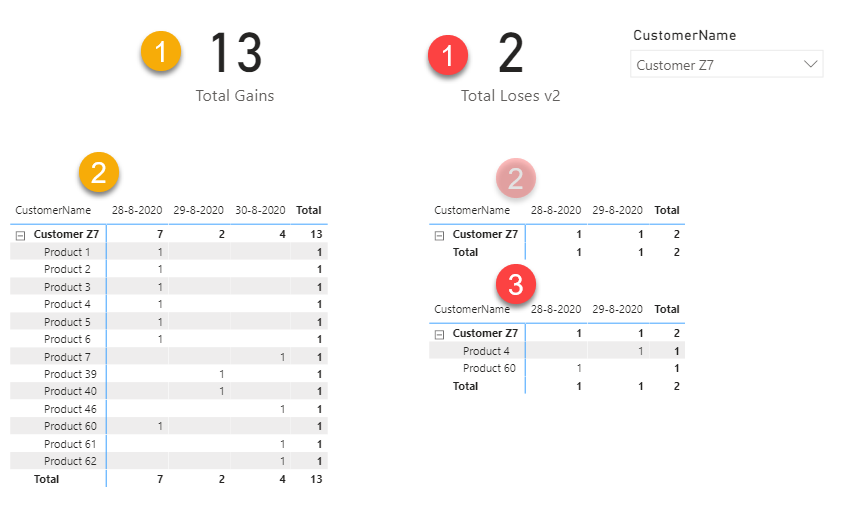
I have attached a .pbix containing some test data.
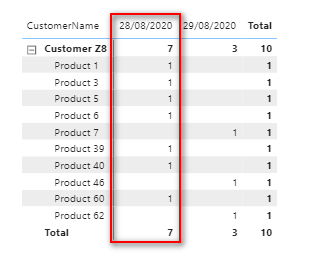
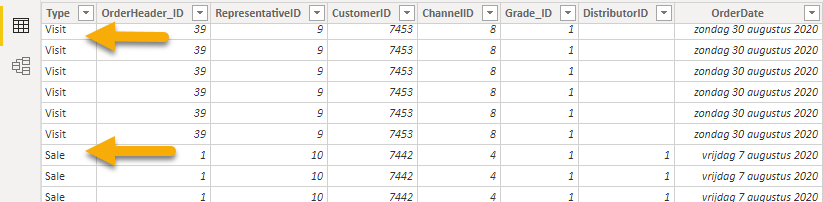
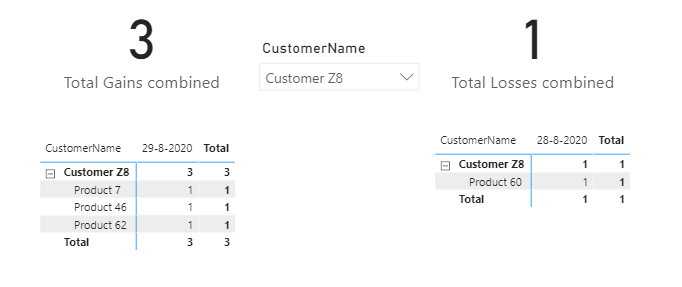
This has a couple of matrices which show the visit data and order data - stored in separate tables (the visit matrix does not show the visit on 27/8/2020 because no products were listed so only a header record exists - how can I show visit?

I’m assuming I need to combine both the visit and order tables, into a virtual table perhaps, and iterate through this working out for each visit/order whether a gain or loss was achieved. However, I really don’t know how to start with this - I’m struggling to visualize how to combine the data in such a way that I can work this out.

Any help would be appreciated.

Thanks
Tiran

Here’s the .pbix
Ranging Gain Test 1.pbix (370.2 KB)

Hi @t.irani, we aim to consistently improve the topics being posted on the forum to help you in getting a strong solution faster. While waiting for a response, here are some tips so you can get the most out of the forum and other Enterprise DNA resources.

  • Use the forum search to discover if your query has been asked before by another member.

  • When posting a topic with formula make sure that it is correctly formatted to preformated text </>.

  • Use the proper category that best describes your topic

  • Provide as much context to a question as possible.

  • Include demo pbix file, images of the entire scenario you are dealing with, screenshot of the data model, details of how you want to visualize a result, and any other supporting links and details.

I also suggest that you check the forum guideline https://forum.enterprisedna.co/t/how-to-use-the-enterprise-dna-support-forum/3951. Not adhering to it may sometimes cause delay in getting an answer.

Hi @t.irani,

This proved more difficult then I expected…
Total Gains pretty straight forward.

Total Gains = 
VAR vTable =
FILTER(
    ADDCOLUMNS(
        CROSSJOIN( VALUES( Customer[Customer_ID] ), VALUES( 'Product'[Item_ID] )),
        "@Date", COALESCE( 
            MIN( CALCULATE( MIN( Sales[OrderDate] ), REMOVEFILTERS( Dates )), CALCULATE( MIN( Visits[VisitDate] ), REMOVEFILTERS( Dates ))), 
            CALCULATE( MIN( Sales[OrderDate] ), REMOVEFILTERS( Dates )), 
            CALCULATE( MIN( Visits[VisitDate] ), REMOVEFILTERS( Dates )))
    ), [@Date] <> BLANK() && [Customer_ID] <> BLANK() && [Item_ID] <> BLANK()
)
RETURN

COUNTROWS( FILTER( vTable, [@Date] IN VALUES( Dates[Date] )) )

.

But Total Losses that had me going around in circles… had the correct results but couldn’t show the item number. Looping through it twice is not pretty but it works…

Total Loses v2 = 
VAR MaxDate =
COALESCE( 
    MAX( CALCULATE( MAX( Sales[OrderDate] ), ALLSELECTED( Dates )), CALCULATE( MAX( Visits[VisitDate] ), ALLSELECTED( Dates ))), 
    CALCULATE( MAX( Sales[OrderDate] ), ALLSELECTED( Dates )), 
    CALCULATE( MAX( Visits[VisitDate] ), ALLSELECTED( Dates ))
)
VAR vTableFieldsBase =
FILTER(
    ADDCOLUMNS(
        CROSSJOIN( VALUES( Customer[Customer_ID] ), VALUES( 'Product'[Item_ID] )),
        "@Date", COALESCE( 
            MAX( CALCULATE( MAX( Sales[OrderDate] ), ALLSELECTED( Dates )), CALCULATE( MAX( Visits[VisitDate] ), ALLSELECTED( Dates ))), 
            CALCULATE( MAX( Sales[OrderDate] ), ALLSELECTED( Dates )), 
            CALCULATE( MAX( Visits[VisitDate] ), ALLSELECTED( Dates )))
    ), AND( [@Date] = MaxDate, [@Date] IN VALUES( Dates[Date] )) && [Customer_ID] <> BLANK() && [Item_ID] <> BLANK()
)
VAR vTableTotals =
FILTER(
    ADDCOLUMNS(
        CROSSJOIN( VALUES( Customer[Customer_ID] ), VALUES( 'Product'[Item_ID] )),
        "@Date", COALESCE( 
            MAX( CALCULATE( MAX( Sales[OrderDate] ), ALLSELECTED( Dates )), CALCULATE( MAX( Visits[VisitDate] ), ALLSELECTED( Dates ))), 
            CALCULATE( MAX( Sales[OrderDate] ), ALLSELECTED( Dates )), 
            CALCULATE( MAX( Visits[VisitDate] ), ALLSELECTED( Dates )))
    ), AND( [@Date] <> MaxDate, [@Date] IN VALUES( Dates[Date] )) && [Customer_ID] <> BLANK() && [Item_ID] <> BLANK()
)
VAR LastDay = 
CALCULATE(    
    MAX( CALCULATE( MAX( Sales[OrderDate] ), REMOVEFILTERS( Dates )), CALCULATE( MAX( Visits[VisitDate] ), REMOVEFILTERS( Dates ))),
    ALL( Dates ), ALL( 'Product' )
)
VAR vTableFields = FILTER( vTableFieldsBase, [@Date] < LastDay )

RETURN

IF( ISINSCOPE( 'Product'[Item_ID] ),
    COUNTROWS( vTableFields ),
    COUNTROWS( vTableTotals )
)

.

With this result

If anyone has found better solution, I’m all ears.

Here’s the sample file. eDNA - Ranging Gain Test.pbix (311.1 KB)
I hope this is helpful.

4 Likes

HI Melissa

What can I say, thanks so much for this. I don’t profess to understand the DAX right now but will work my way through it.

There are a couple of scenarios which are not working however, and I did not make these clear in my original post to avoid too much complication. I have added data to the model for Customer Z8 and Customer Z9 to demonstrate this eDNA - Ranging Gain Test - V2.pbix (317.3 KB).

Quantities recorded on the very first customer visit are not counted as gains. Here’s the scenario for a new customer I’ve added to the model - Customer Z8.

image

Values captured in Visit #1 on 28/8/2020 are not counted as gains. However, in the model these are included in the total. The gain should only be the 3 items from Visit #2.

image

Is there a way of ignoring these values from the very first visit?

Also, there’s a nuance in the way that losses are handled in that if they are recorded as a loss but subsequently re-appear, they are no longer a loss - just an out of stock. Here’s a scenario that demonstrates this for Customer Z9.

My final question: all of these gains and losses are ‘reset’, from a reporting point of view, at the start of a new financial year (July 1). Is this logic something that would need to be built into your DAX measure or handled external to them?

Once again, many thanks for your input so far - this has been making my head hurt!

Regards
Tiran

Hi @t.irani,

Thanks for providing the additional details. Don’t have any questions at the moment.
Just a heads up - I’m pretty swamped so I won’t be able to revisit this before tonight.

No problem Melissa, I appreciate your help with this.
Regards
Tiran

Hi @t.irani,

With the 2 separate fact tables it was really becoming difficult to keep sufficient context, so I decided to combine them in 1 fact table with an additional attribute Type column.

This made it a whole lot easier, as you can see here:

Total Gains combined = 
VAR MinDate = CALCULATE( MIN( fCombined[OrderDate] ), FILTER( ALL( Dates ), Dates[Date] IN DATESYTD( Dates[Date], "30-6" )), ALL( 'Product'))
VAR MaxDate = CALCULATE( MAX( fCombined[OrderDate] ), FILTER( ALL( Dates ), Dates[Date] IN DATESYTD( Dates[Date], "30-6" )), ALL( 'Product'))

VAR vTable =
FILTER(
    ADDCOLUMNS(
        SUMMARIZE( fCombined, Customer[Customer_ID], 'Product'[Item_ID], Dates[Date] ),
        "@Date", CALCULATE( MIN( fCombined[OrderDate] ), REMOVEFILTERS( Dates ))
    ), [Date] = [@Date] && [Item_ID] <> BLANK() && [Customer_ID] <> BLANK()
)
RETURN

COUNTROWS( FILTER( vTable, [@Date] > MinDate && [@Date] <= MaxDate ))

.
and for Losses the measure is now almost identical.

Total Losses combined = 
VAR MinDate = CALCULATE( MIN( fCombined[OrderDate] ), FILTER( ALL( Dates ), Dates[Date] IN DATESYTD( Dates[Date], "30-6" )), ALL( 'Product'))
VAR MaxDate = CALCULATE( MAX( fCombined[OrderDate] ), FILTER( ALL( Dates ), Dates[Date] IN DATESYTD( Dates[Date], "30-6" )), ALL( 'Product'))
VAR vTable =
FILTER(
    ADDCOLUMNS(
        SUMMARIZE( fCombined, Customer[Customer_ID], 'Product'[Item_ID], Dates[Date] ),
        "@Date", CALCULATE( MAX( fCombined[OrderDate] ), REMOVEFILTERS( Dates ))
    ), [Date] = [@Date] && [Item_ID] <> BLANK() && [Customer_ID] <> BLANK()
)
RETURN

COUNTROWS( FILTER( vTable, [@Date] >= MinDate && [@Date] < MaxDate ))

.
with the expected results
image

Here is your file. eDNA - Ranging Gain Test.pbix (357.9 KB)
Gains and Losses single table.xlsx (32.9 KB)

I hope this is helpful.

3 Likes

Hi Melissa

Thanks again for this, much appreciated.
What you’ve done in combining the tables sort of makes sense.

I have created an SQL view in my application database, which replicates the combining of the two tables, and am using this as the data source for the fCombined table in my main model and adjusted the DAX accordingly. At face value so far, this looks like it’s working.

I have a bit more testing to do. I have a couple of application testers that are adding more order and visit data in various combinations so will be able to do more validation over the next few days.

With your help, I’m now able to start building out some reports & dashboards which should meet the business requirements.

Once again - many thanks & have a great weekend.

Regards
Tiran

Hi Melissa
I hope you don’t mind me replying to this post again? I have applied the DAX formula to my main model and am getting good results for gains.

I now have the need to show month to date values in addition to year to date.
I have created a new measure (Total Gains MTD), based on your original DAX, as below but don’t believe I’m getting the correct results.

I changed the MinDate & MaxDate variable calculations to use DATESMTD instead of DATESYTD.
Do you think this be all I should need to change?

Here’s the modified version.

Total Gains MTD = 
VAR MinDate =
    CALCULATE (
        MIN ( FactCombined[TransactionDate] ),
        FILTER ( ALL ( Dates ), Dates[DMY] IN DATESMTD ( Dates[DMY] ) ),
        ALL ( 'Item' )
    )
VAR MaxDate =
    CALCULATE (
        MAX ( FactCombined[TransactionDate] ),
        FILTER ( ALL ( Dates ), Dates[DMY] IN DATESMTD ( Dates[DMY] ) ),
        ALL ( 'Item' )
    )
VAR vTable =
    FILTER (
        ADDCOLUMNS (
            SUMMARIZE ( FactCombined, Customer[Customer_ID], 'Item'[Item_ID], Dates[DMY] ),
            "@Date", CALCULATE ( MIN ( FactCombined[TransactionDate] ), REMOVEFILTERS ( Dates ) )
        ),
        [DMY] = [@Date]
            && [Item_ID] <> BLANK ()
            && [Customer_ID] <> BLANK ()
    )
RETURN
    IF (
        ISBLANK (
            COUNTROWS ( FILTER ( vTable, [@Date] > MinDate && [@Date] <= MaxDate ) )
        ),
        0,
        COUNTROWS ( FILTER ( vTable, [@Date] > MinDate && [@Date] <= MaxDate ) )
    )

Thanks in advance.
Tiran