Hello all
In this model, i’m working with 3 fact tables connected relatively to dates through date column.
One of the table is call time table, where all employees put their time in their jobs. This table is still very small.
My Tab Dates, has a column (DueWorkTime) that if typeDay is weekday then add 8 (hours) else 0.
I’ve merge this table with time table and add that DueWorkTime column. Now, if the employee is to be controlled, then add that DueWorkTime column, else 0. Then i did this measure:
T DueWorkTime = CALCULATE( SUM(‘Tab Dates’[DueWorkTime] ),
USERELATIONSHIP( ‘Tab Dates’[Date], ‘Tab TimeSheet’[Date]))
My report has 3 filters, Dates, Employee name and business unit. All those are in the same table.
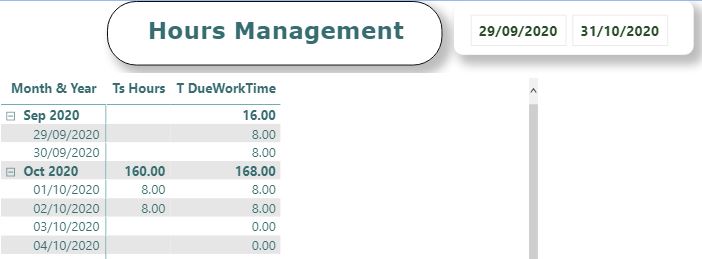
My visual, if i select a specific date, from 29/9 till 31/10 it’s suppose to show all 32 days and in those days, the hours worked and the hours that was suppose to work. This hour worked measure is:
Ts Hours = CALCULATE(SUM( ‘Tab TimeSheet’[Time (h)]),
USERELATIONSHIP( ‘Tab Dates’[Date], ‘Tab TimeSheet’[Date] ))
So far so good, as you can see. It shows all calendar days and only the hours worked by that person.
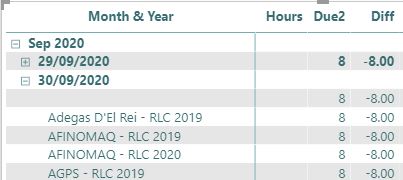
But when i add the project ID it, this happens
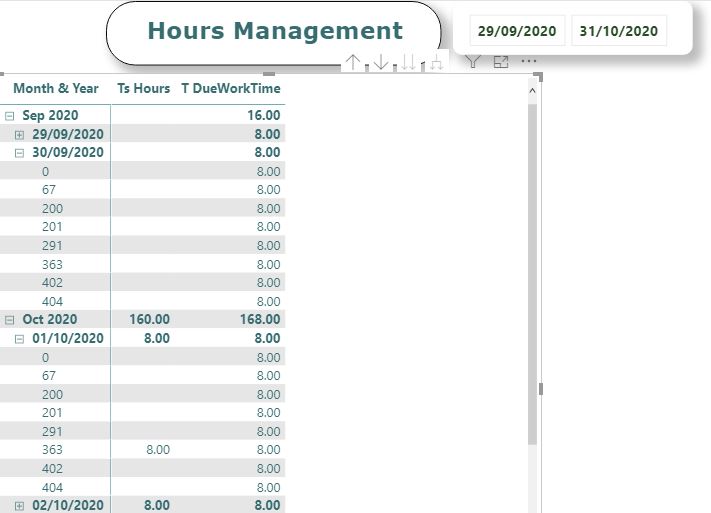
it shows all the projects ID for this person no matter the day. But if i want to add the project name instead, which is linked to that table (Tab Projects), it shows every project for each calendar day. And it was supposed to show only the information for each day that the employee have worked.
Finishing the first measure above (T DueWorkTime) Works IF i’ve select only one employee name. But if i select any, i mean all, it shows only 8 hours instead of 8 times number employees. Easy to fix?
I don’t have enough knowledge to at least understand where’s my mistake or how should i do it instead.
Can anybody help me? I’m attaching a file
Thanks a lot
Pedro
TM.xlsx (127.5 KB)