Thanks @Melissa
There is no specific reason. Using #table we can get all the required columns in one step.
Thanks @Melissa
There is no specific reason. Using #table we can get all the required columns in one step.
Here goes my solution for the Week-04. 
Sorry guys, I missed delivering the Week-03 challenge on time as I was quite busy for the last two weeks but, hey, that’s on my To-Do list and I will soon deliver that too. 
I’m really enjoying the challenges and can’t afford to lose a week and I think it’s always better to be late than never. 
Week04_Addressing Granularity Issue_DAX.pbix (498.7 KB)
Great to have you back - we missed you in POTW #3.
You raise a great point about going back and doing the problem(s) you might have missed. We all have competing work, family, and other personal committments that sometimes make it difficult or impossible to participate in events like Data Challenges or POTW at the time they’re happening.
This is why we’ve set up a separate section on the portal for all the Problem of the Week intro and solution videos:
and a Problem of the Week topic on the forum, where you can find all the files and posts, organized by week/problem:
https://forum.enterprisedna.co/c/problem-of-the-week/51
So, if any of you find yourself in the midst of a tough stretch, just know that Problem of the Week will be waiting patiently for you when you get back. ![]()
Note also that this serves as a great reference archive - just this week on the forum there have been a number of posts about budget data granularity, where the techniques we’re discussing in POTW #4 would be highly relvant.
Look who made it when she is struggling with exams and work :  Yes it’s me !!!

Check my solution below 
POTW #4 Final_Amira Bedhiafi.pbix (505.4 KB)
Indeed and I really love this idea of saving data challenges and POTW. Due to time constraints and other priorities, I couldn’t able to participate in most of the data challenges, however, they are on my To-Do list too and I will be addressing them soon.
Thanks for the links @BrianJ
Hi All. I’m much better in DAX than I am in PQ, but wanted to stretch myself a bit, so please bear with me.
Greg
All,
Here’s an email submission received from Samantha Pikus (thanks for participating!)
POTW #4 Final_SammiP.pbix (499.3 KB)
All,
And another email submission, this one from Matteo Arellano. Great to have you as part of the POTW gang!
Really nicely done. Your M code is formatted beautifully and your steps are well documented – made it really easy to review this solution.
Thanks for taking the time to participate, particularly during what sounds like a very challenging week. Good luck with your exams!
– Brian
Hello,
I hope you are all keeping well.
A massive thank you and well done to all participants of problem of the week. It’s amazing to see so many of you getting on board and tackling these and putting what you learn into practice.
We are always trying to come up with super relevant and industry-based scenarios that we know are going to be common hurdles you will face as a power bi analyst.
As always, if you have any ideas or would like us to cover anything then please don’t be afraid to reach out and we’d be happy to listen (we’re a friendly bunch I promise!).
This week’s solution video can be found here.
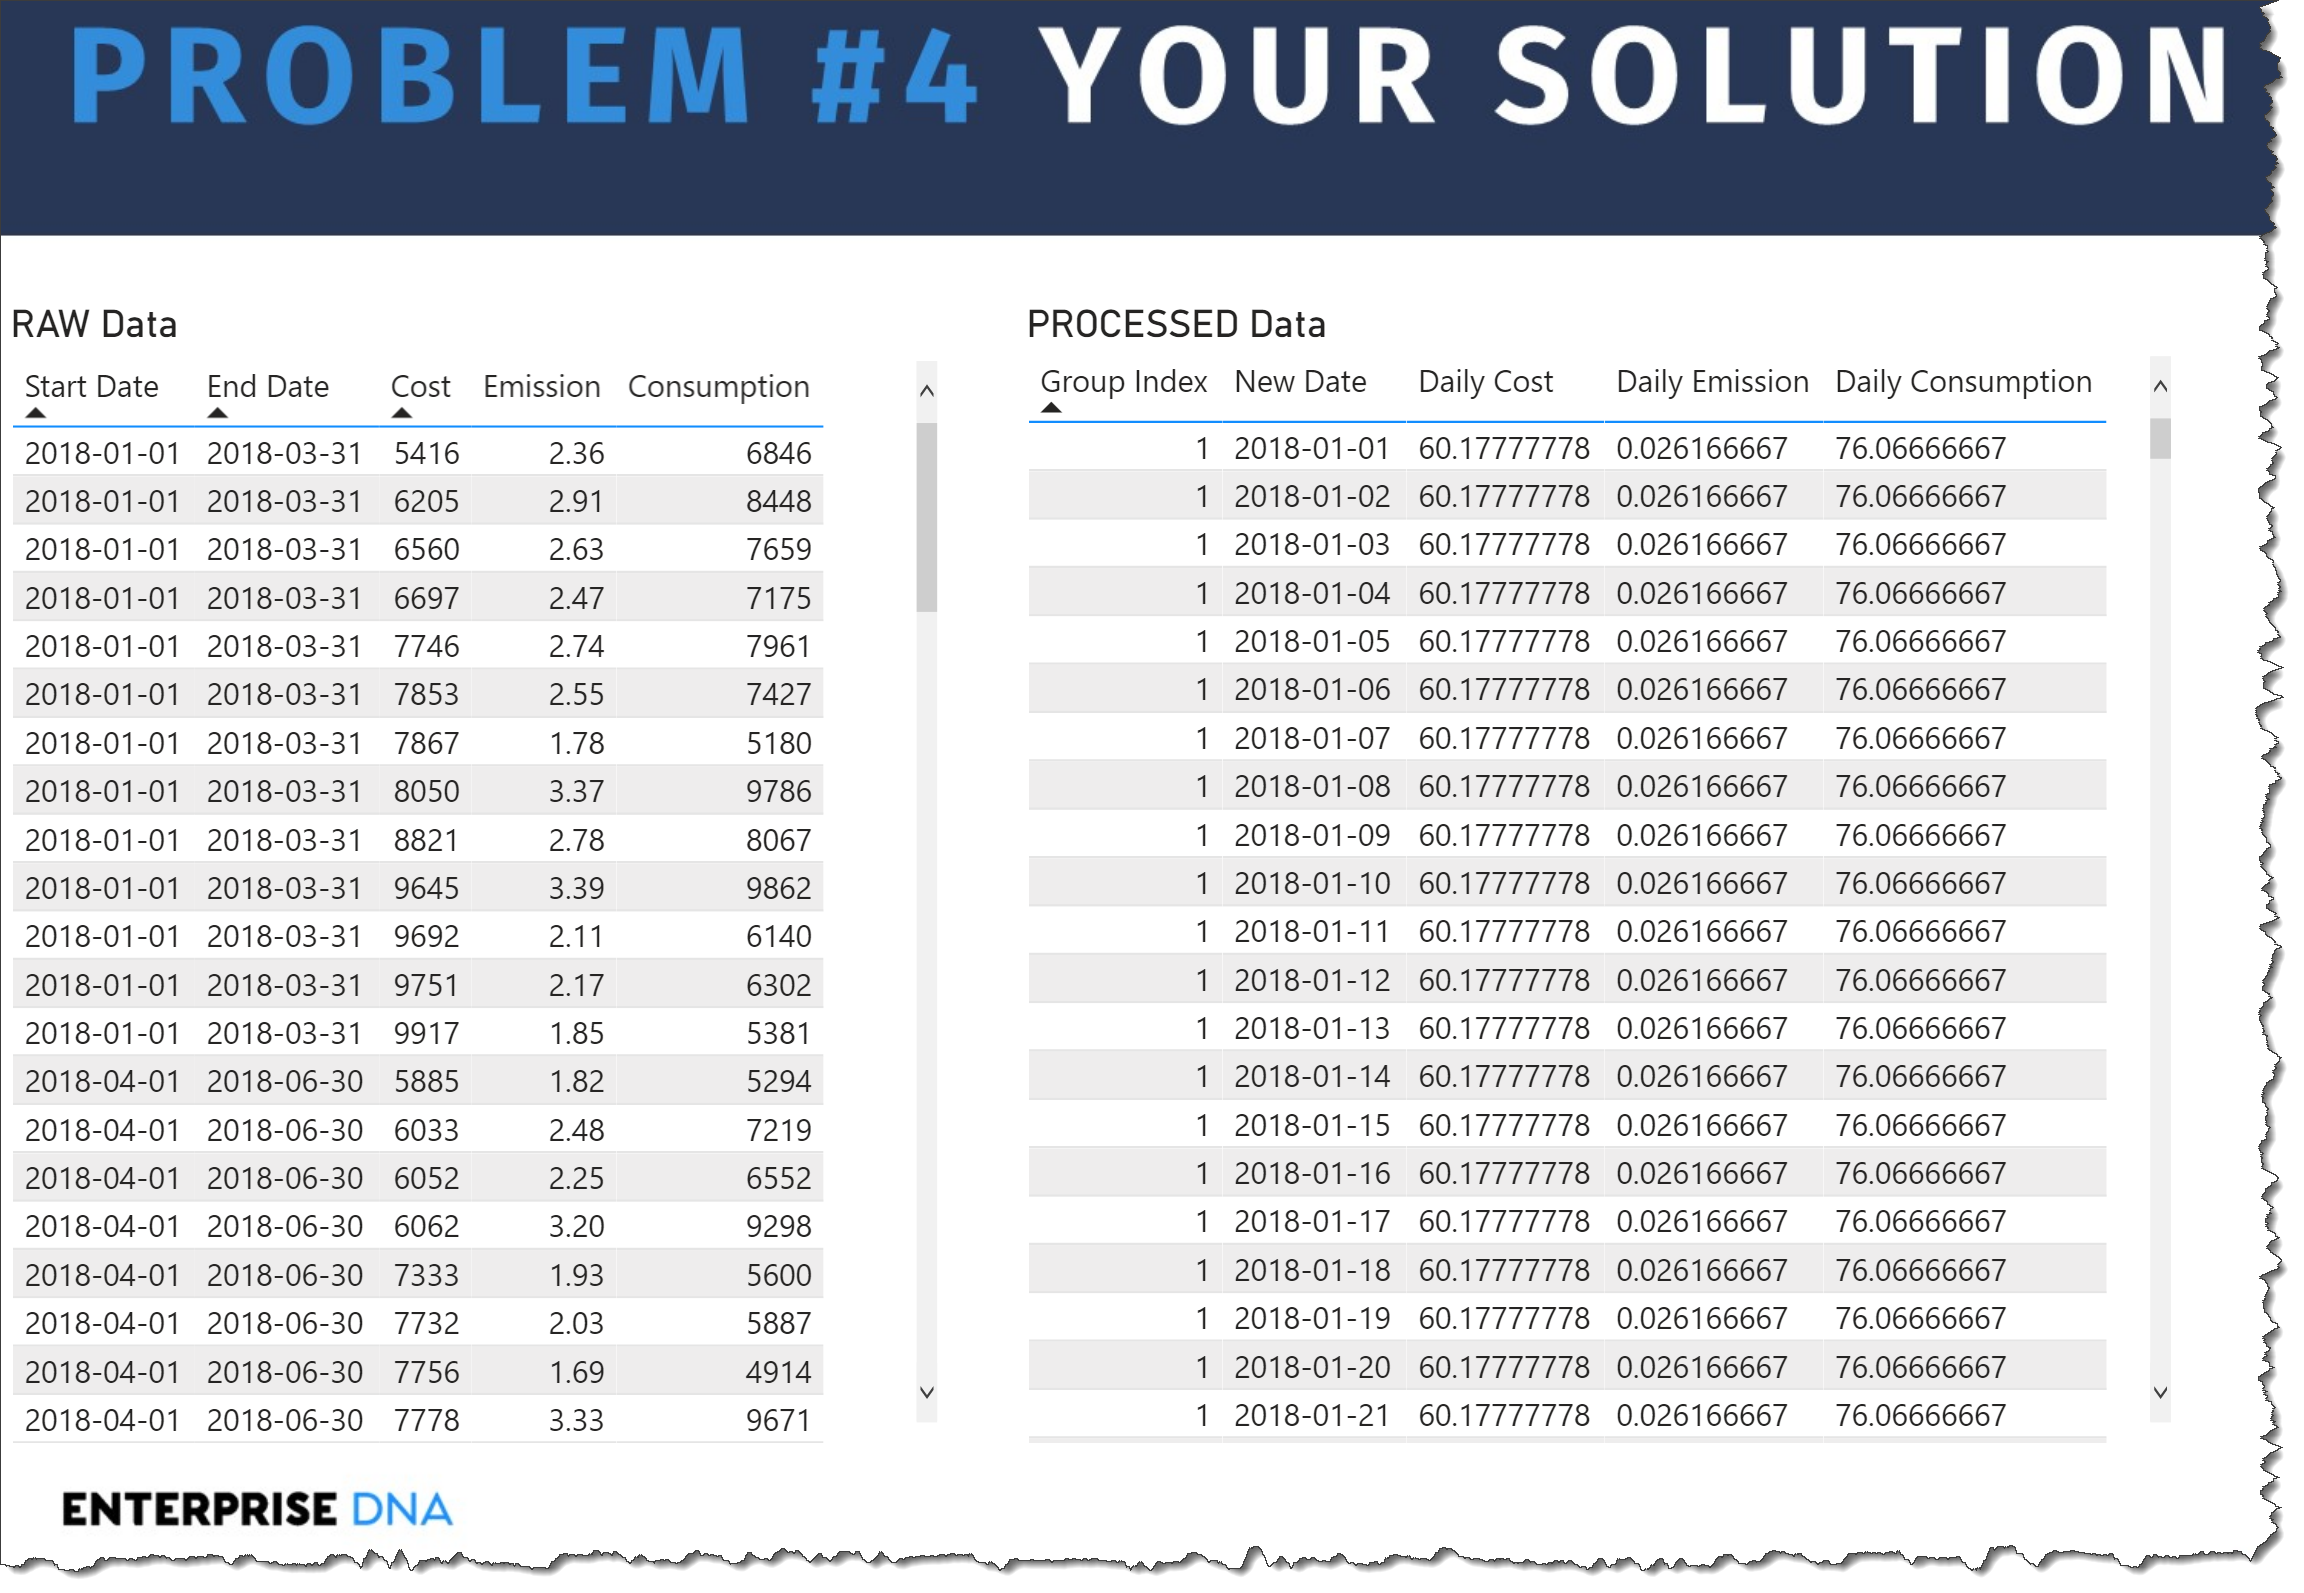
The problem this week did not present the variations we’ve all come to expect in Power BI with 101 ways to achieve the same thing. Most of us took a similar approach to the problem which can be distilled into the following steps.
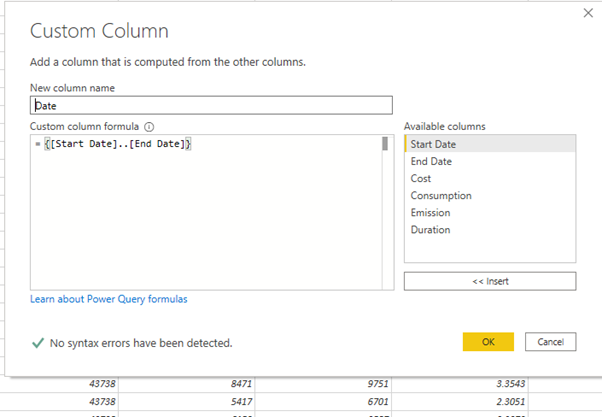
If you use a simple list method, then all you need to is convert the date to an integer and the using {} construct you can get a list between the two values. If you try creating a list with the Date data type it will error.
You could also use the List.dates to achieve this as below:
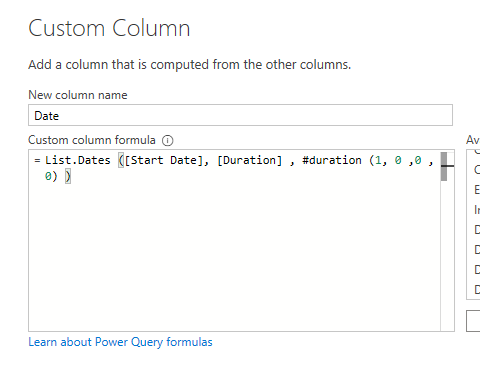
Where duration is what we calculated in the first step.
I think for the third point there was probably an even split between people using the dates as integer and creating a list or using list dates. Both worked and achieved the desired results.
I think it was also nice to see some great tips and tricks being shared across the forum from entrants.
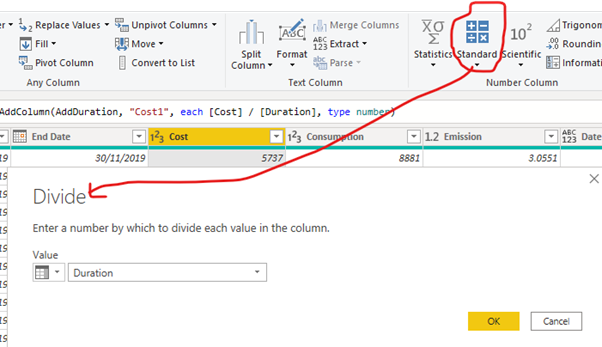
I think the one that’s sticking with me is why write code when you can get the UI to generate it for you! I think Melissa’s solution of handling the divisions in one step is an awesome example of this.
Be sure to check it out above.
I think that’s all from me folks. Once again thank you all for participating and I hope you enjoyed the problem.
Thanks,
Haroon
All,
Three more solutions that came in via email: Peter, Vida Vaitkunaite, and Eric LaForce. Big thanks to all three of you for participating! Great to see not only the Enterprise DNA members participating in POTW, but also also a lot of folks from the larger Power BI community.
Solution Summary from Vida:
In the first step I obtained a list of dates with List syntax {first number … last number}. I used Number.From to convert dates to numbers and added 1 to the last date, so that it is also included: {Number.From([Start Date]) … Number.From([End Date])+1}
I then expanded List to rows. Unfortunately I couldn’t change number to date by adding ‘type date’ or ‘Date.Type’ at the end of the formula
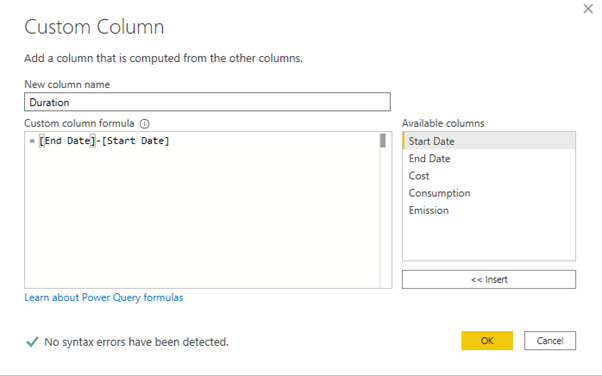
Duration of days was simply calculated by subtracting start date from end date. 1 extra day was added too.
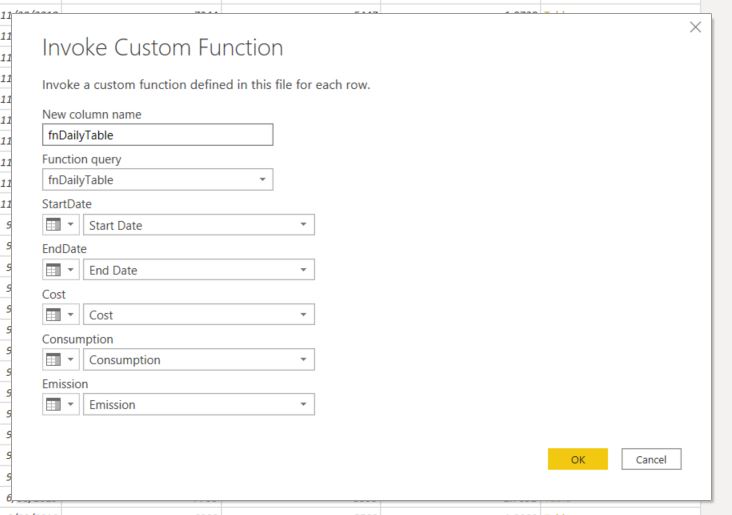
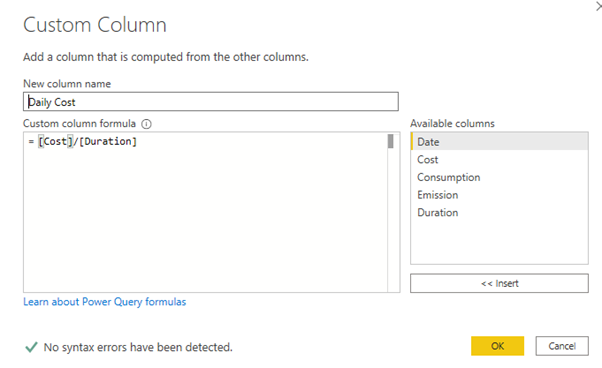
I then used UI to calculate daily Cost, Consumption and Emission:
I was able to insert data type ‘type number’ manually at the end of the function.
Then I just removed other columns, renamed them and finally changed number to Date, which I couldn’t do inside the function.
All the steps were done with UI, only data types were added manually inside few steps.
Full Code:
Inline image
Comments and Analysis from Eric:
As personal habit I always try & prefer to keep things SIMPLE
Preconising to focus & decompose subject/item 1 at a time.
Instead of looking for more sophisticated or intricated solution
First I’m not yet confident enough, in my quite new knowledge about PQ /DAX and POWERBI to go with more complexe ones … :=)
But also and mainly because I’m also definitely sure, with now years of programming experiences that
if you need to get back to your work later : For any teason
It will always be EASIER & MORE EFFICIENT with a very SIMPLE structure & methodology than with a more complex one
Only criterias against it : can be SPEED/ MEMORY /TIME limits or contraints
Or educational & example purposes. If you want to show or help other to discover something new.
Thanks & glad to share these experiences with all of you.
ERIC
POTW #4 Final - Vida.pbix (499.6 KB)
POTW #4 Final.pbix (733.1 KB)
eDNA POTW 4 - ChangingGranularity - ErLaf.pbix (689.1 KB)
Hi all,
Here’s another entry sent via email from Sayali:
Summary of Steps -
- Calculate no of days between Start Date & End Data
- Calculate Daily Cost, Emission & Consumption
- Create a custom column for list for dates between with Start Date & End Date
- Expand custom column
POTW #4_SD.pbix (500.1 KB)
Problem of the Week Participants,
Amazing job everyone on this week’s problem, and big thanks to @haroonali1000 for doing a terrific job leading this round . I think I counted 17 solutions submitted, the best total so far to date – this initiative continues to grow each week. Really gratifying to see folks enjoying these, learning from them and sharing ideas around solutions. Also great to see people going back and working through past ones.
At the end of each round, we’ve been doing random drawings of five submissions for these custom laptop stickers that we had printed. However, rather than doing the drawing this week, we just want to say thanks to everyone who’s made this initiative a success, so if you’ve submitted a solution to this week’s problem or any of the past ones and haven’t already received a sticker – if you’d like one, just send your physical mailing address to me at problemoftheweek@enterprisedna.co (note: people keep sending me their email addresses, but until @sam.mckay authorizes me to purchase teleportation equipment, I’m going to have to rely on the Postal Service to get you your stickers. ![]() ).
).

So catch a breather this weekend, and we’ll be back at it next week with a new DAX problem led by Enterprise DNA Expert @MudassirAli.
Thanks again for participating, and for those who haven’t given it a try yet hope to see you next week!
– Brian
P.S. If you submitted your address for problem #3, your sticker is on the way – mail in and out out of DC has been exceedingly slow lately, perhaps due to additional security around the inauguration.
You’ve been busy @JBocher …I suspect there may be a few more to come too 
Great job, tbh, I need to go through these also, thanks for the motivational nudge
#nudgetheory
David
i need to go through these too…need more hours in the day!
I hear you @KimC I just aim to do a minimum of 5-10 mins learning every day, that way I feel I have improved slightly and it’s a great way of building the learning habit. Some days I’ll be able to spend a few hours learning, other days just 5-10 mins. The Enterprise DNA Youtube channel has so many great videos, I’ll stick one of those on if I’m short of time.
@JBocher ,
More great work - extremely impressive. This problem by @haroonali1000 was absolutely transformative for me and my team. We used to do all of our actual to budgeted granularity adjustments via complex DAX, but now do them all this way in PQ - easier, faster, more intuitive and makes the remaining DAX a cakewalk.