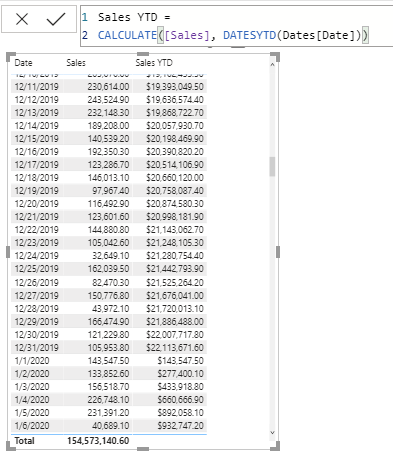
Hi, I am struggling to calculate year totals for comparison in a table against monthly totals for that year, say to see what contribution each month made to the full year total (eg 2020). When I use the Filter function with Calculate [Sales] or Calculate [All Sales] I end up with the Monthly figure or the Grand Total for all sales not the annual figure.
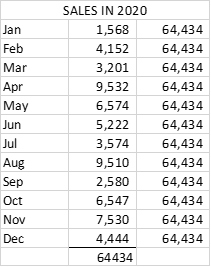
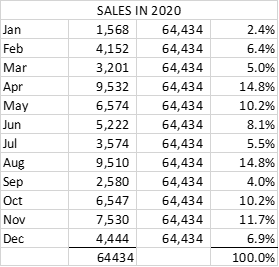
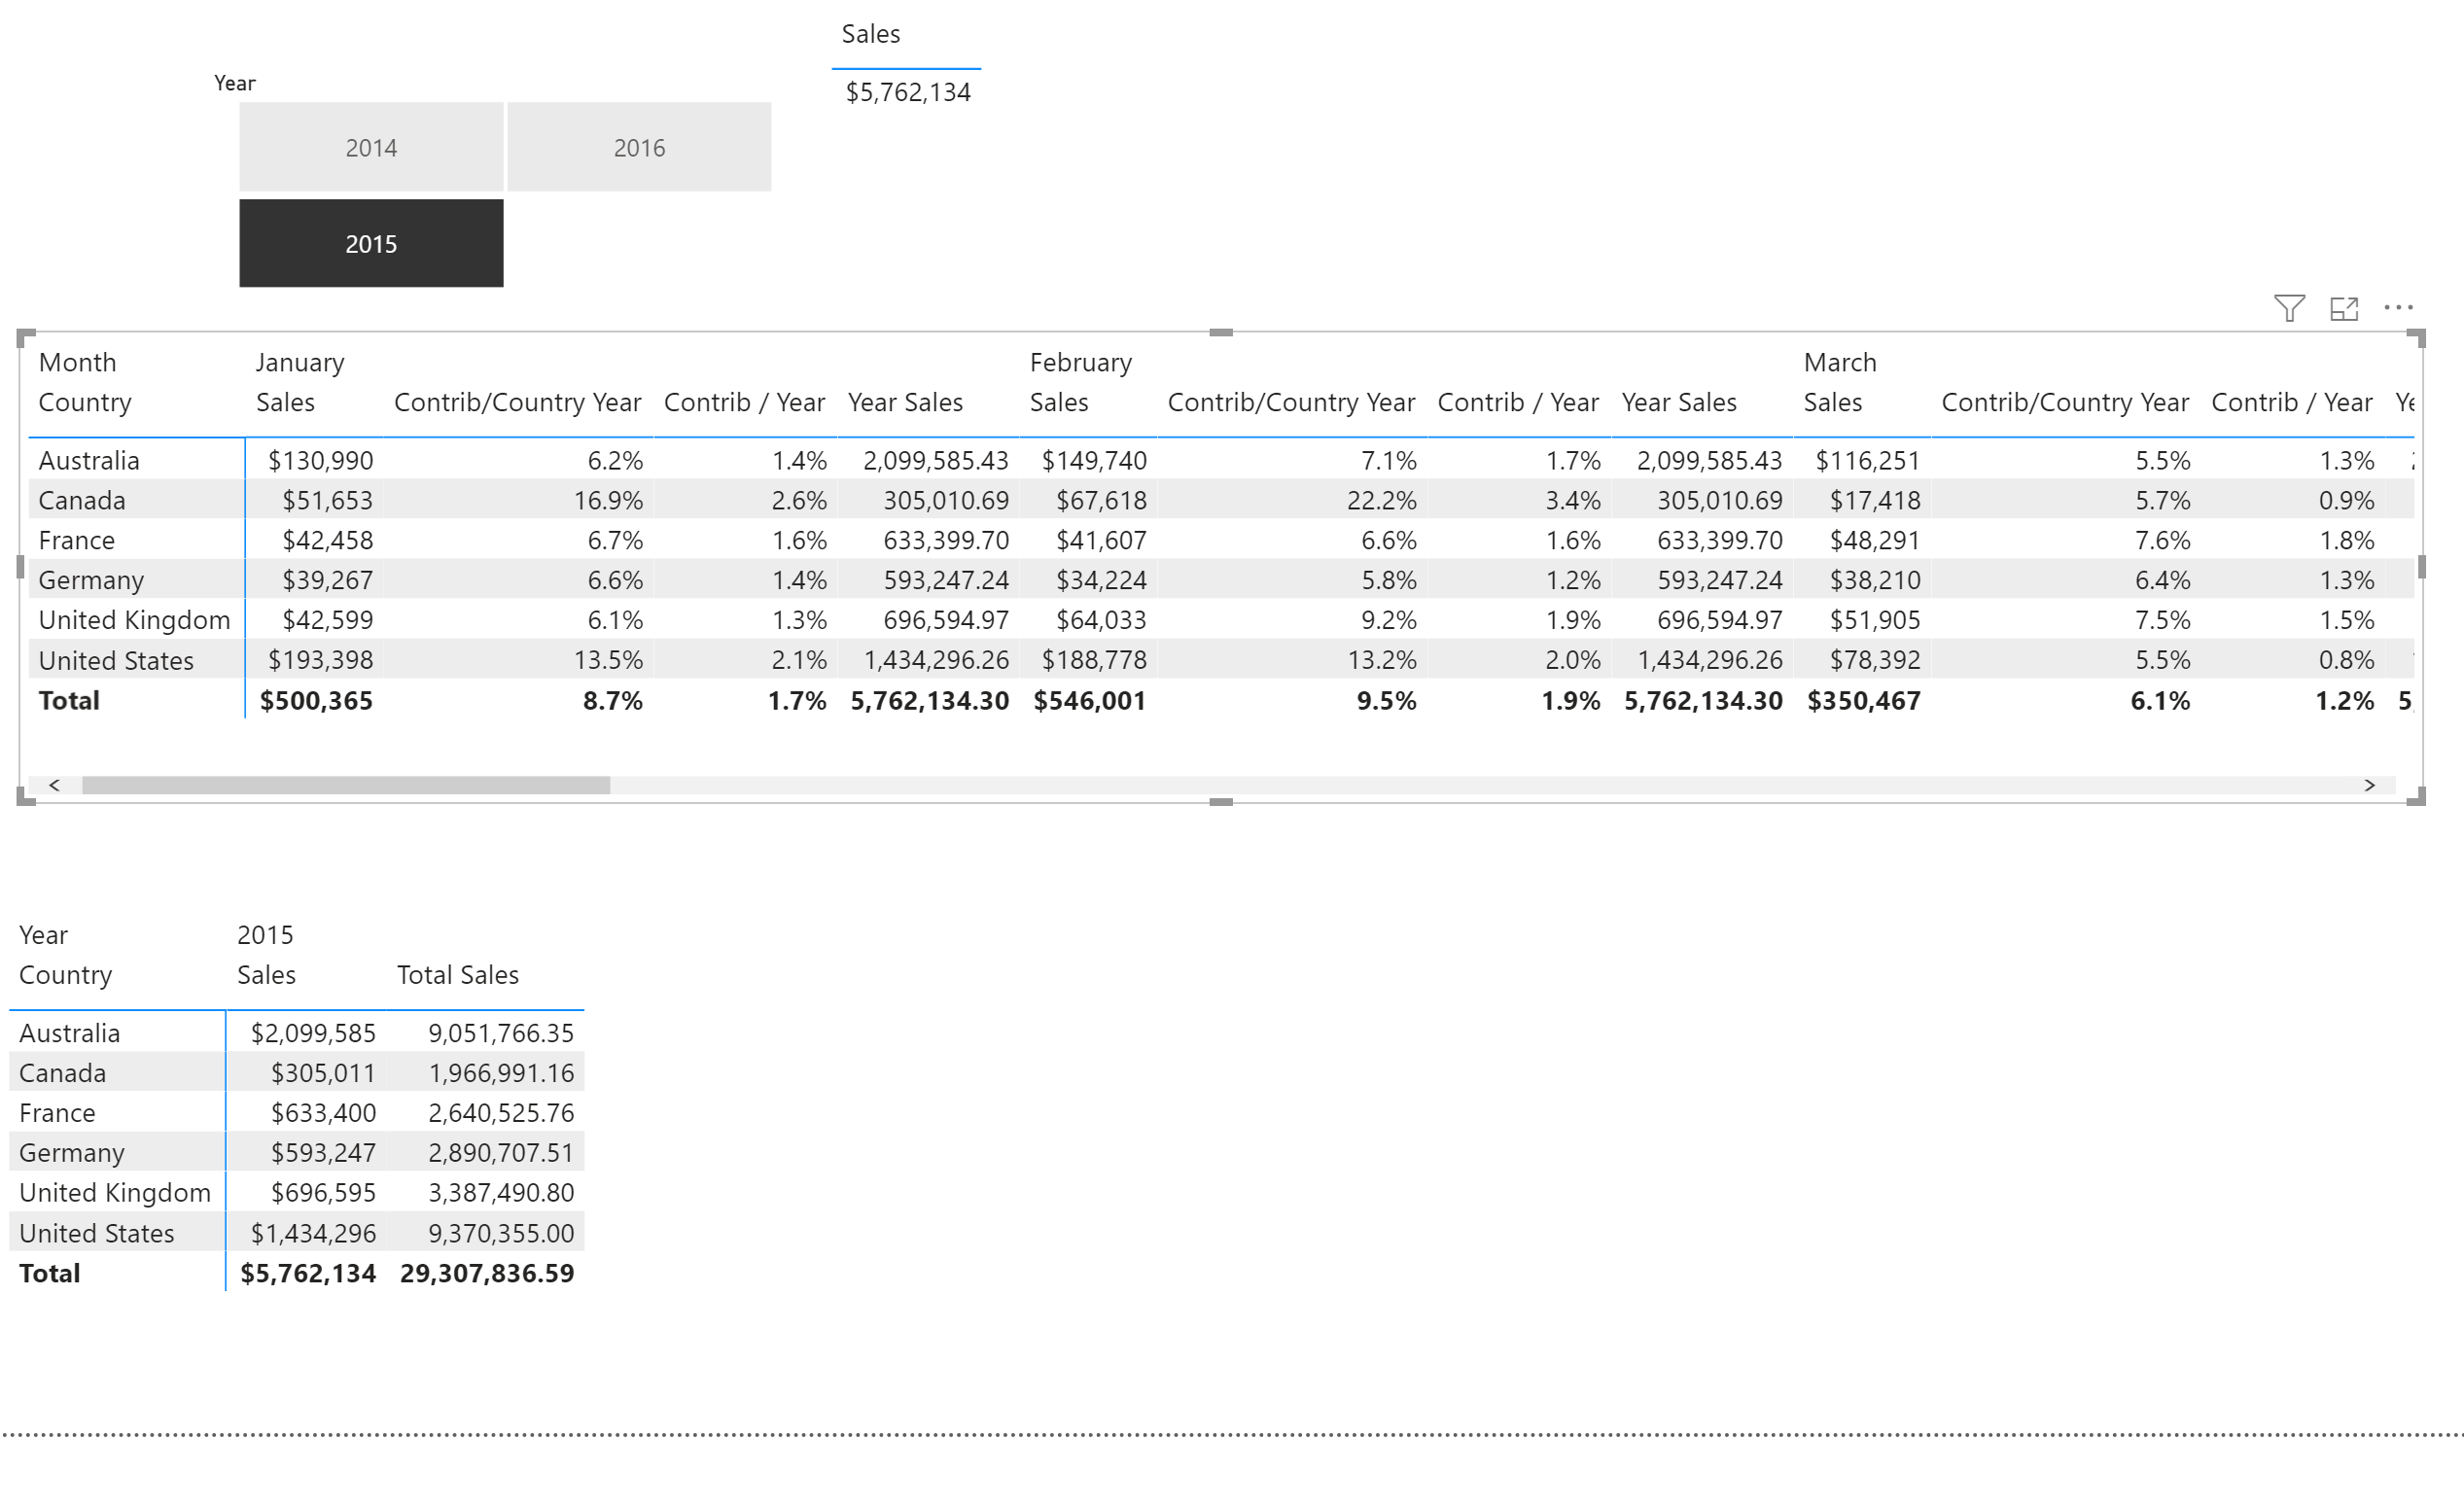
My apologies for not being as clear as I should. I am not looking for YTD but rather the annual total at each level as shown in the attached picture. Ultimately I can then calculate the share of the total attributable to each month. And then I should be repeat the process for all years over a series.
I’m a little confused now. You want a MTD total for each month, or do you want it to be a running YTD for each Month? All you would need to do is replace the Date column with the Month column in my solution, and it will give you a running YTD total. Let me know if you need something different.
I appreciate your help. I have monthly totals. What I am missing is the end of year total. At the end of the day, all I want to do is calculate each month’s share of the total. I might want, for example to compare July’s share of sales over several years
Thank you very much, exactly what I was looking for. I built a matrix over three years and successfully calculated for each month the contribution to the respective year total. Perfect.
I would have thought that this would be a very common task but have not seen any explanation on how to do this anywhere. Thanks again.
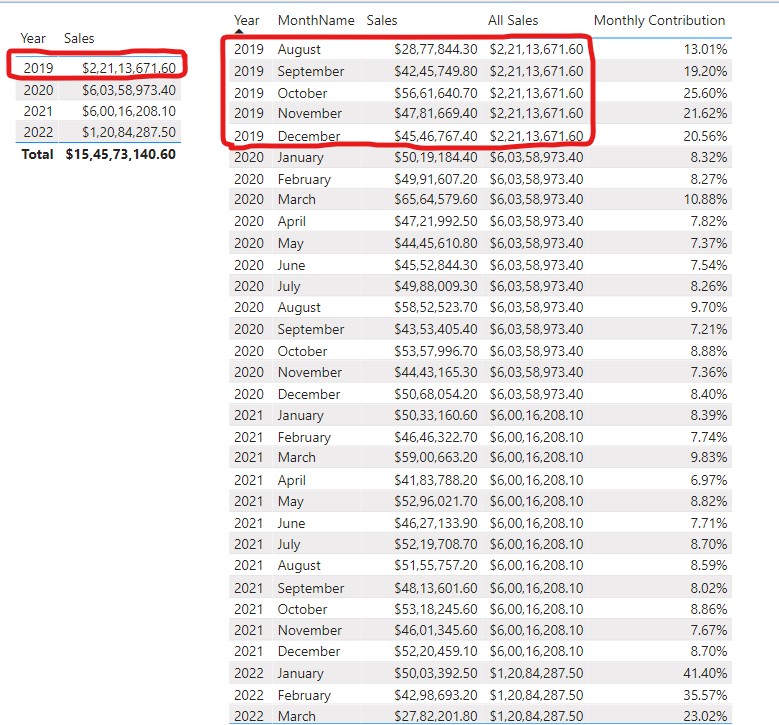
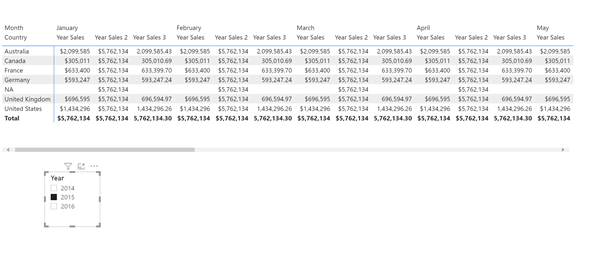
Yesterday’s solution worked perfectly with a single variable but when I added a second variable in a matrix. I encountered an unexpected problem. I was expecting that the Year Sales for each country, in each month would show the total of all countries (ie $5,762,134.30) but rather I end up with the annual total for each country. Useful but not what I was looking for. You can see what is happening in the first screenshot.
The second problem is the the Contrib/Year is based on the Total Sales (of all Years) for each individual country rather than the total of all sales for that year. seond screenshot.
In simple terms, what I am trying to do is set up a table that shows me the monthly contribution to sales for each region for a partiuclar year and then caculate that as a ratio. Australia (Jan)/ All Regions Year total for example.
I solved the problem of getting the aggegate sales for the year across all countries by wrapping the Year Sales measure (which aggregates the total sales for each year for each country) into a another measure.
Year Sales 2 = CALCULATE([Year Sales], ALL(Territories[Country]))
But this seems messy and I would have thought dooable in a single measure.
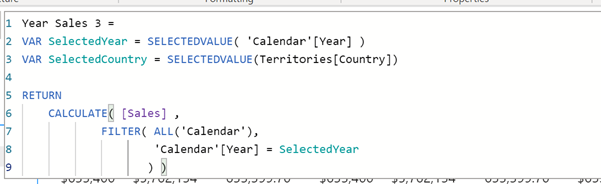
In the attached image, I am trying to get the Year Sales 2 outcome (total sales for all countries for the year) with the Years Sales 3 measure but without the intermediate Years Sales measure.
I have tried to build a measure but I don’t understand how to add two variables into the filter function.
There are many ways to calculate this but I find using an iterator and specifying the tables helps me better understand what is going on. Then you’ll get something like this:
Sales by Year and All Territories =
CALCULATE(
    SUMX(
        Sales,
        Sales[SalesAmount]
    ),
    FILTER(
        ALL( 'Calendar' ),
        'Calendar'[Year] IN VALUES( 'Calendar'[Year] )
    ),
    ALL( Territories )
)
and
Sales by Year and Country =
CALCULATE(
    SUMX(
        Sales,
        Sales[SalesAmount]
    ),
    FILTER(
        ALL( 'Calendar' ),
        'Calendar'[Year] IN VALUES( 'Calendar'[Year] )
    ),
    FILTER(
        ALL( Territories ),
        Territories[Country] IN VALUES( Territories[Country] )
    )
)