Hi @smarta. As with most things in Power BI, there are probably multiple ways of doing the same thing. Here’s one possible solution (if I understood your scenario correctly).
To present this, I:
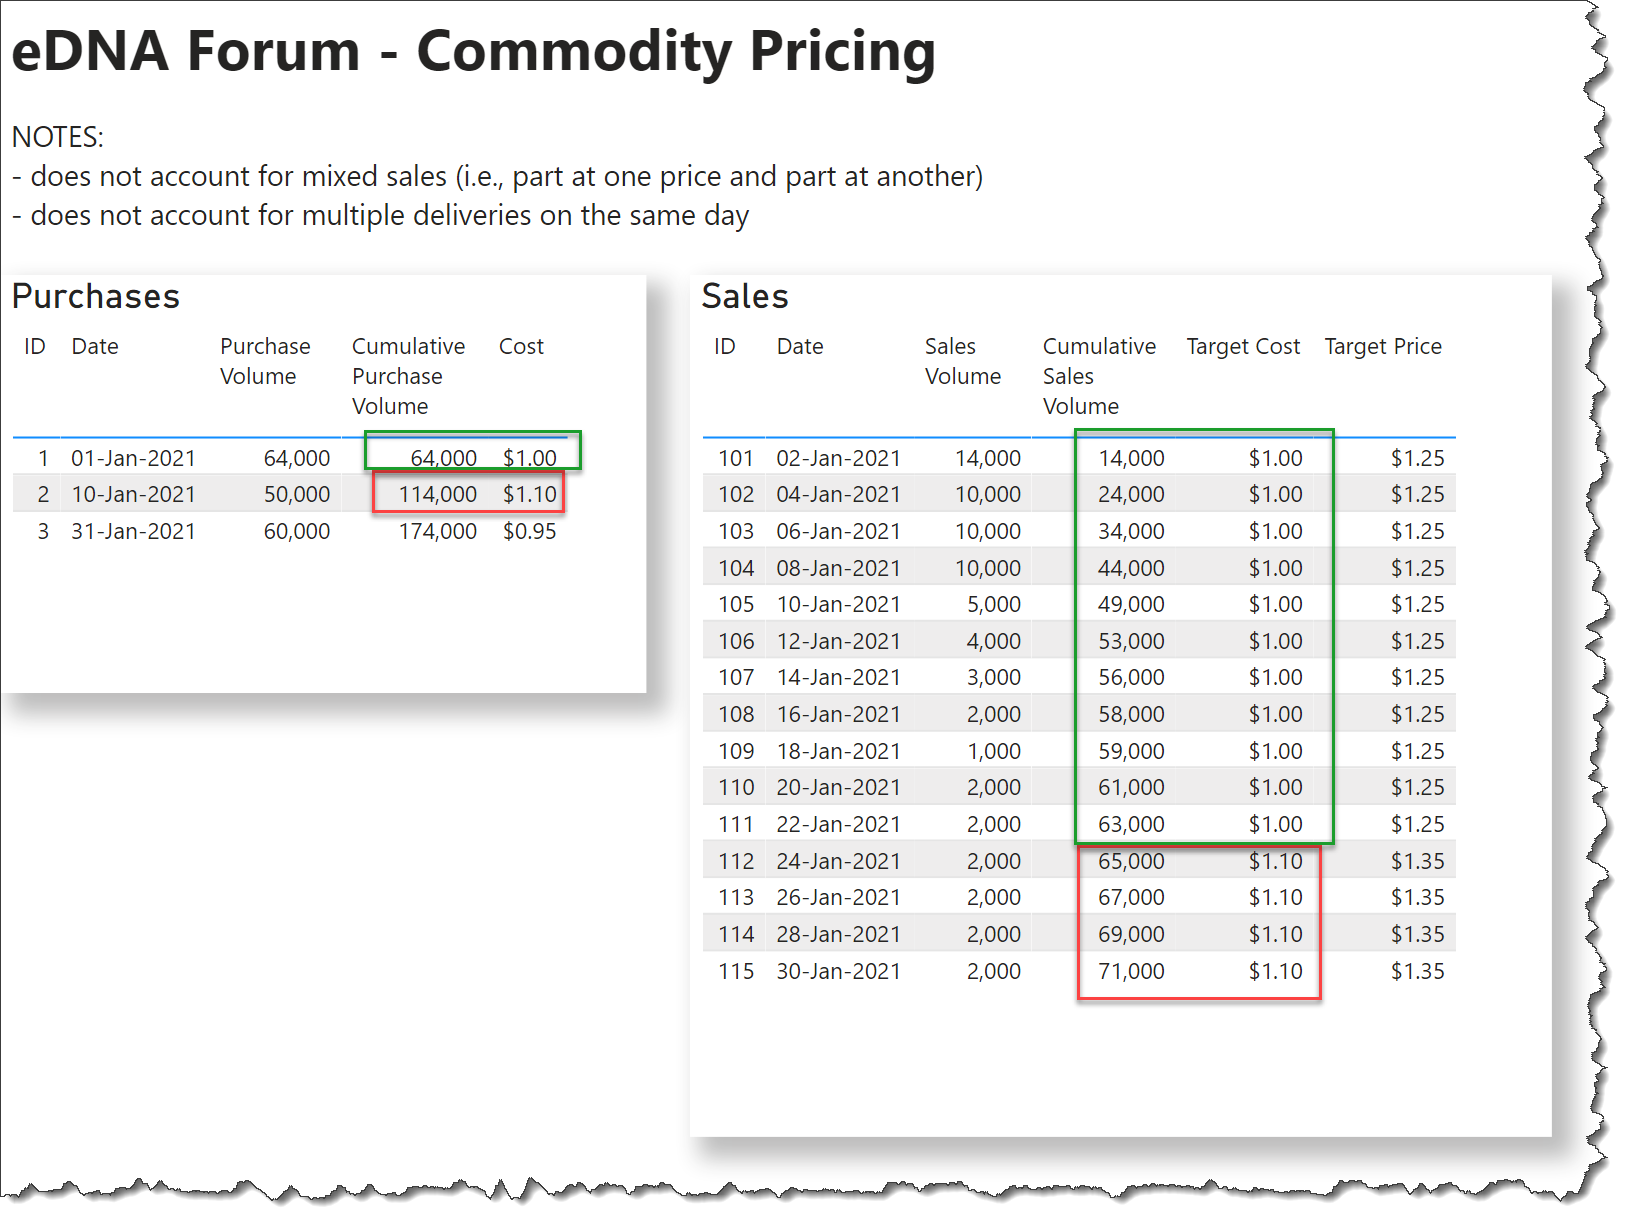
- created separate tables for [Purchases] and [Sales}
- added a calculated column to each (Cumulative Volume)
- added a DATES table and marked it as such (used the Extended Date Table from eDNA, Extended Date Table (Power Query M function))
- added 1:many relationships from Dates[Date] to Purchases[Date] and Sales{Date]
- added [Markup] measure = $0.25
- added [Target Cost] measure
Target Cost =
VAR _CumulativeVolume = SELECTEDVALUE( Sales[Cumulative Sales Volume] )
VAR _AllPurchasesOverCumulative = FILTER(
    Purchases,
    Purchases[Cumulative Purchase Volume] >= _CumulativeVolume
)
VAR _AssociatedPurchase = TOPN(
    1,
    _AllPurchasesOverCumulative,
    Purchases[Cumulative Purchase Volume],
    ASC
)
VAR _Result = IF(
    HASONEVALUE( Sales[ID] ),
    CALCULATE( MAX( Purchases[Cost] ), _AssociatedPurchase ),
    BLANK()
)

RETURN
_Result
Hope this helps.
Greg
eDNA Forum - Commodity Pricing.pbix (88.5 KB)
eDNA Forum - Commodity Pricing.xlsx (12.3 KB)
Notes:
- tested with made-up sample data only
- does not account for “mixed” purchases (i.e., where part of the sale is at one price and the remainder of the sale at a different price [in example, see sale 112])
- to use the sample without change, both PBIX and EXCEL files should be downloaded to the local C:\Temp\ folder