Thanks a lot @BrianJ
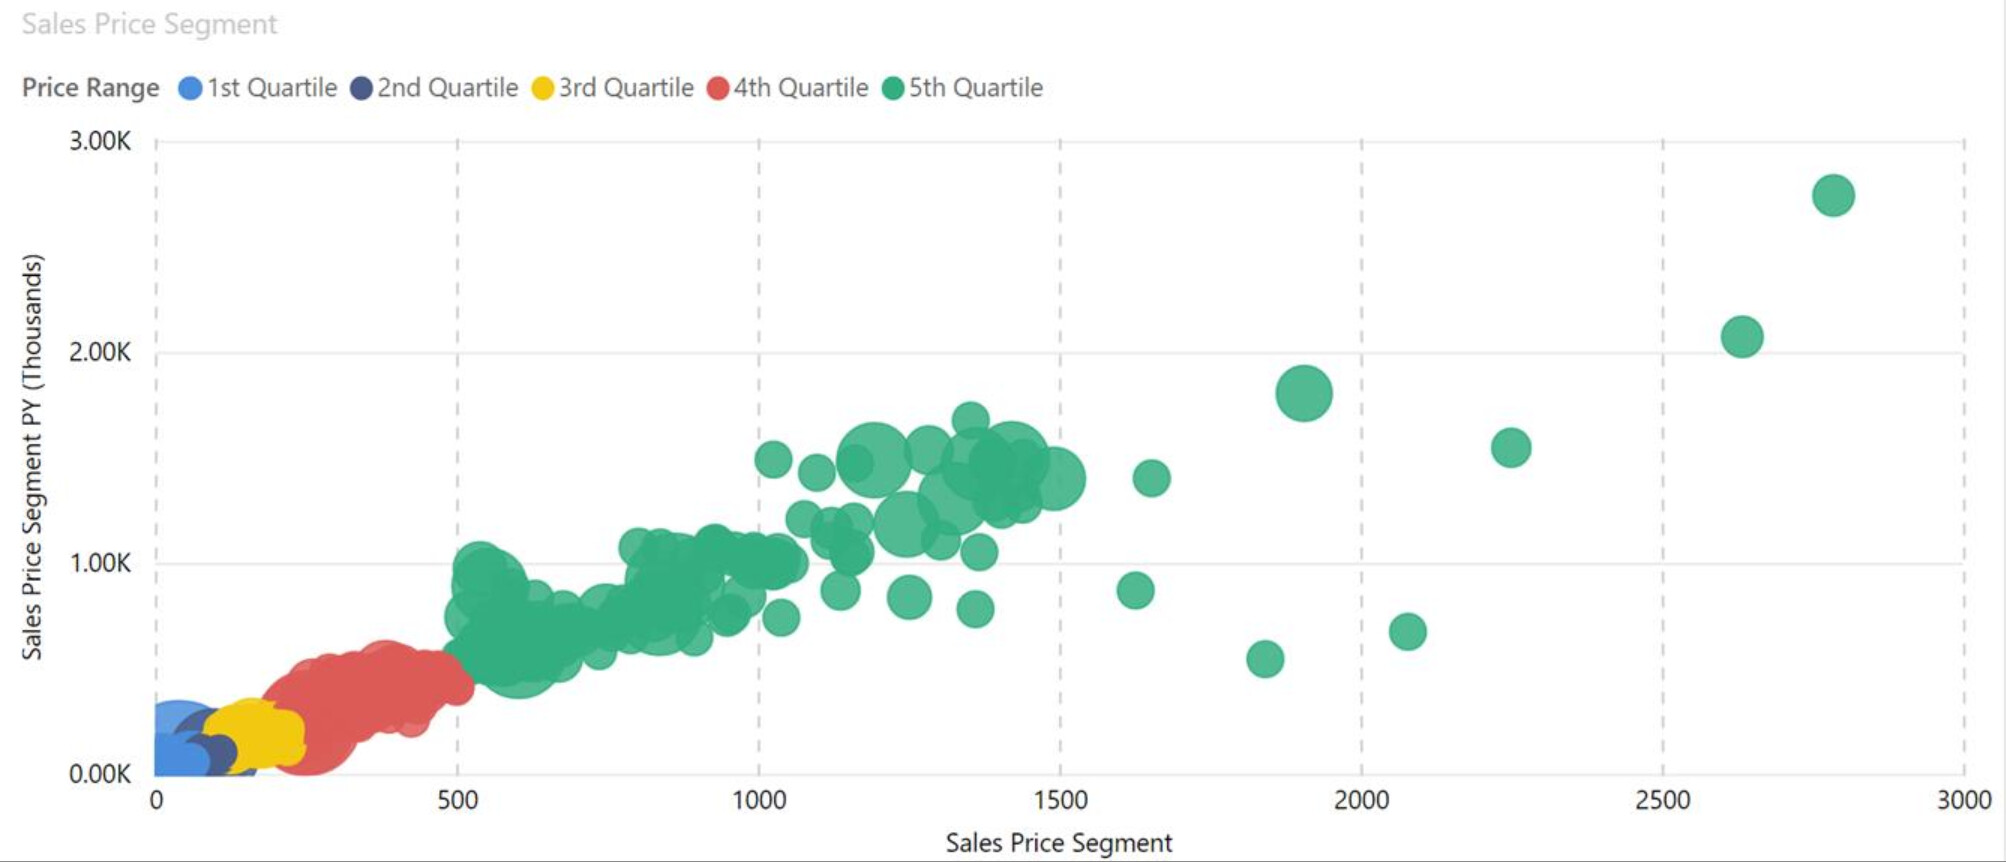
This is roughly what I later want to achieve and then be able to filter on each category. Got the inspiration from Sam in one of the courses on “dynamic banding” or a similar name 
Y-Axis
Sales Per PriceSegment =
SUMX (
    VALUES ( 'Date'[Year] ),
    VAR ProductsInSegment =
        FILTER (
            ALLSELECTED ( Product[ARTICLE] ),
            VAR SalesOfProduct = [Sales Price]
            VAR SegmentForProduct =
                FILTER (
                    'PriceSegments',
                    NOT ISBLANK ( SalesOfProduct )
                        && 'PriceSegments'[Min Price] < SalesOfProduct
                        && 'PriceSegments'[Max Price] >= SalesOfProduct
                )
            VAR IsProductInSegments = NOT ISEMPTY ( SegmentForProduct )
            RETURN
                IsProductInSegments
        )
    VAR Result =
        CALCULATE ( [Sales], KEEPFILTERS ( ProductsInSegment ) )
    RETURN
        Result
)
.
X-Axis
Sales Price Segment =
SUMX (
    VALUES ( 'Calendar'[Year] ),
    VAR ProductsInSegment =
        FILTER (
            ALLSELECTED ( Product[ARTICLE] ),
            VAR SalesOfProduct = [Sales Price]
            VAR SegmentForProduct =
                FILTER (
                    'PriceSegments',
                    NOT ISBLANK ( SalesOfProduct )
                        && 'PriceSegments'[Min Price] < SalesOfProduct
                        && 'PriceSegments'[Max Price] >= SalesOfProduct
                )
            VAR IsProductInSegments = NOT ISEMPTY ( SegmentForProduct )
            RETURN
                IsProductInSegments
        )
    VAR Result =
        CALCULATE ( [Sales Price], KEEPFILTERS ( ProductsInSegment ) )
    RETURN
        Result
)
.
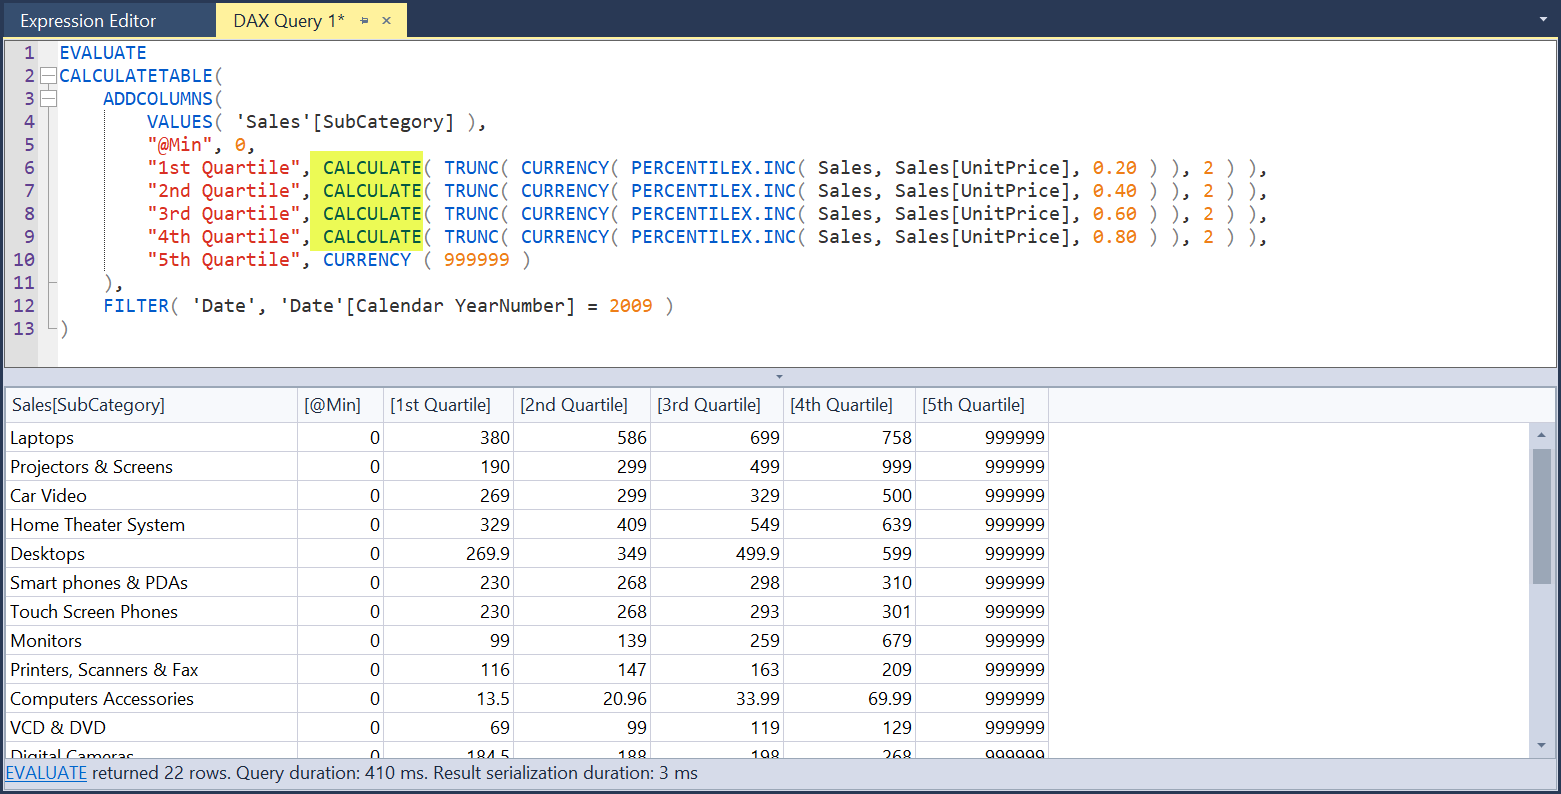
The only problem with the above measures is that they relied on a table that looked like this
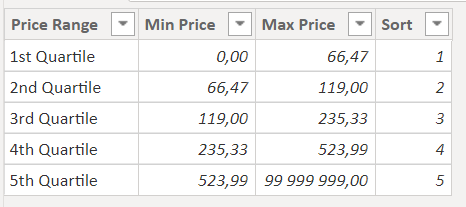
with this dax
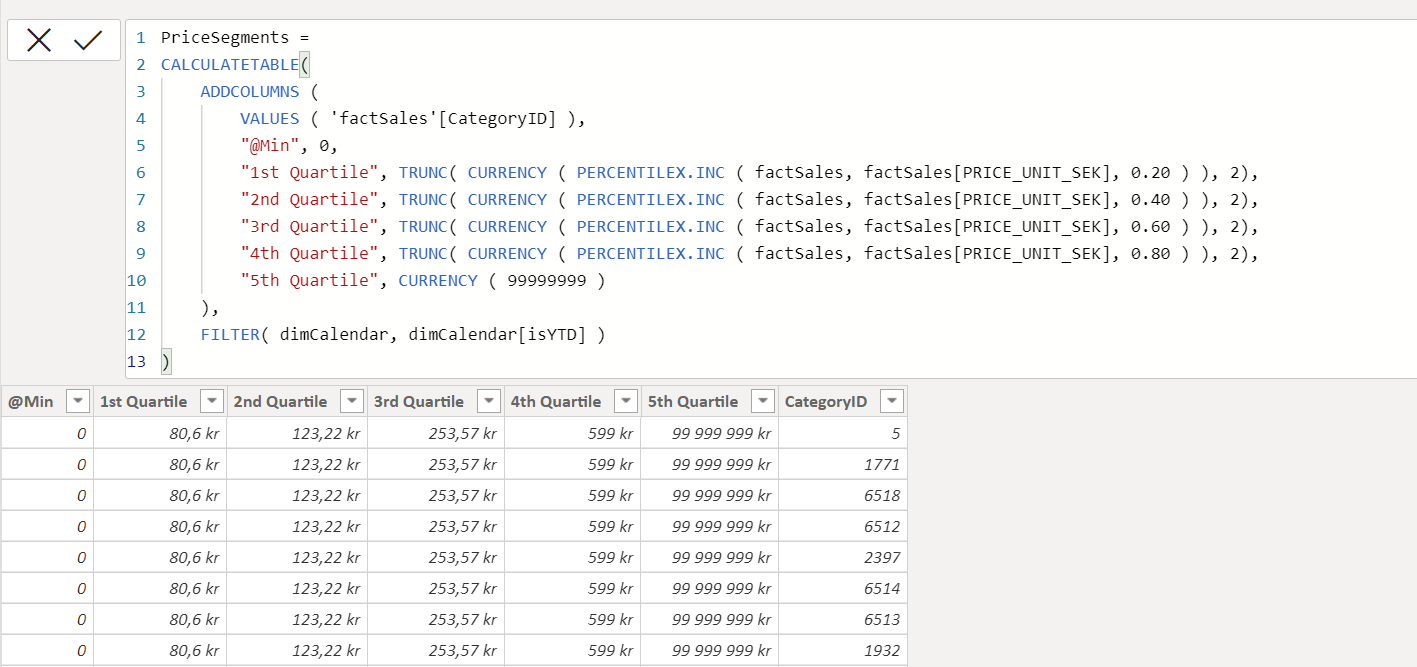
PriceSegments =
UNION (
    ROW (
        "Price Range", "1st Quartile",
        "Sort", INT( 1),
        "Min Price", CURRENCY ( 0 ),
        "Max Price", CURRENCY ( PERCENTILEX.INC ( factSales, factSales[PRICE_UNIT_SEK], 0.20 ) )
    ),
    ROW (
        "Price Range", "2nd Quartile",
        "Sort", INT( 2),
        "Min Price", CURRENCY ( PERCENTILEX.INC ( factSales, factSales[PRICE_UNIT_SEK], 0.20 ) ),
        "Max Price", CURRENCY ( PERCENTILEX.INC ( factSales, factSales[PRICE_UNIT_SEK], 0.40 ) )
    ),
    ROW (
        "Price Range", "3rd Quartile",
        "Sort", INT( 3),
        "Min Price", CURRENCY ( PERCENTILEX.INC ( factSales, factSales[PRICE_UNIT_SEK], 0.40 ) ),
        "Max Price", CURRENCY ( PERCENTILEX.INC ( factSales, factSales[PRICE_UNIT_SEK], 0.60 ) )
    ),
    ROW (
        "Price Range", "4th Quartile",
        "Sort", INT( 4),
        "Min Price", CURRENCY ( PERCENTILEX.INC ( factSales, factSales[PRICE_UNIT_SEK], 0.60 ) ),
        "Max Price", CURRENCY ( PERCENTILEX.INC ( factSales, factSales[PRICE_UNIT_SEK], 0.80 ) )
    ),
    ROW (
        "Price Range", "5th Quartile",
        "Sort", INT( 5),
        "Min Price", CURRENCY ( PERCENTILEX.INC ( factSales, factSales[PRICE_UNIT_SEK], 0.80 ) ),
        "Max Price", CURRENCY ( 99999999 )
    )
)
.
So I will need to think that one through as well 
 Will continue to have at it, and hopefully have a solution back to you later today.