Previousmonth (Ignoring date slicer context)

Hi all,

I am new to Power BI but enjoying the ride of being on a steep learning curve.

I am creating a DAX measure using PREVIOUSMONTH.

For example:

Failure Rate Previous Month = CALCULATE( [Failure Rate], PREVIOUSMONTH( Dates[Date] ) )

The output works perfectly and I will use it however I would also like a measure that outputs the PREVIOUSMONTH no matter what is in my date slicer on my page. I will use this measure on a card.
So no matter what it will always show the last months rate from today (eg. July 21 result given we are currently in August 21).

I have been playing around with FILTERS, MIN and MAX dates and ALLEXCEPT without success.

Any help is greatly appreciated.

Thanks,

Ty

@tylaird

Do you have a sample PBIX file with masked data we could look at it?

From the sounds of it, the ALL function may be what you need to remove context away from your dates. I believe it should go within the PREVIOUSMONTH part like so:

Failure Rate Previous Month = CALCULATE( [Failure Rate], PREVIOUSMONTH( ALL(Dates[Date] ) ) )

But I’m still learning myself so not 100% of if that will work without playing around with it!

Hi @tylaird

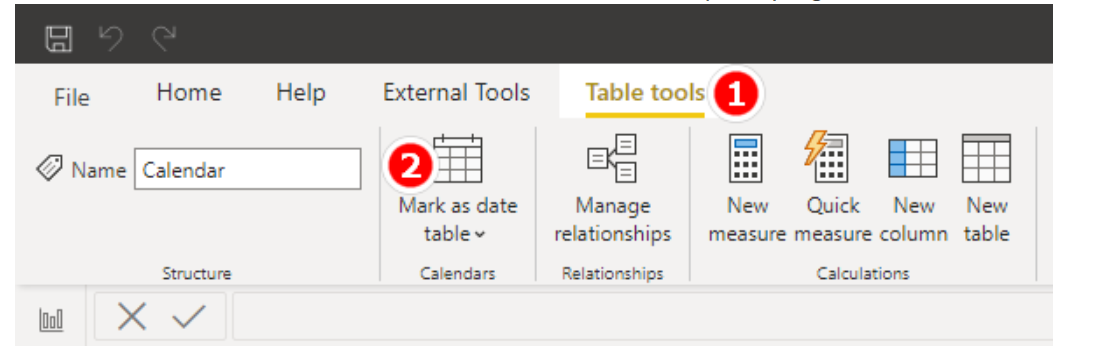
To use time intelligence functions in Power BI, you need to have a table that contains at least one column that has a data type of Date. This column should have only one row per day for all the range of dates with no gaps. In other words you need a Calendar Table and don’t forget mark as date table. If you don’t have one use @Melissa Date table is the best.

Ty Example.pbix (90.9 KB)

Hi Jamie,

Thanks for the quick reply and attempt. I thought your solution would work but it didn’t.

I have attached a dummy file that shows what I am trying to achieve.

You will see I have the PREVIOUSMONTH time intelligence function working. However, I would like a card that always shows the LASTMONTH regardless of the date filter. /

In my case, a CARD named LAST MONTH and the value would be 16.50%

My PREVIOUSMONTH dax formula will display whatever the previousmonth is based on the left hand side of the date slicer.

Thank you :slight_smile:

Ty

Hi @jbressan ,
Thanks for the reply. I have a dates table and model setup.
I have provided more details and a sample file in my reply to @jamie.bryan above.
Thank you,
Ty

Hi @tylaird,

Please receive hereby a possible workout of your request “I would like a measure that outputs the PREVIOUSMONTH no matter what is in my date slicer on my page.”

  • A standalone calculated table, filtered giving the requested last month failure rate, which is not connected in the data model. This table is independent from your date slicer.

    Shadow Last Month FailureRate = 
        CALCULATETABLE(
                 ADDCOLUMNS( 
                      SUMMARIZE( Dates, Dates[MonthInCalendar]),
                           "Shadow Previous Month Failure Rate", [Previous Month Failure Rate]),
                              FILTER( ALL(Failures), MONTH(Failures[Failure Date]) = MONTH(MAX( Failures[Failure Date]))))
    

See PBIX attached:
Ty Example Failure rate prev month independent from slicer.pbix (93.6 KB)

Note 1) The measure “Previous Month Failure Rate” needs context like it has in the table with “Month in Calendar”, as a card without date context becomes blank.

Note 2) Just a question: Do you need the figure “Latest last month Failure-rate” as a separate number ? Generally speaking calculated tables should be used as minimal as possible.

The (outcome of the) calculated table presented in green:
image

If there would be a measure solution available, I would be happy to hear.

I hope it answers your question,

Kind regards, JW

3 Likes

@tylaird First thing, That date table is pretty annoying lol, the column names do not convey what actually mean and store, I had to jump back and forth again and again. Then the MonthNYear and QuarterNYear columns have extra zeroes.

I added a new column Calendar Year Month Number, which has been used in the DAX code.
Ty Example.pbix (83.6 KB)

Second Last Month Failure Rate = 
VAR LastVisibleMonth = 
    CALCULATE ( 
        MAX ( Dates[Calendar Year Month Number] ),
        ALLSELECTED ( Dates )
    )
VAR ImmediatePriorMonth = 
    CALCULATE ( 
        MAX ( Dates[Calendar Year Month Number] ),
        Dates[Calendar Year Month Number] < LastVisibleMonth,
        REMOVEFILTERS ( Dates )
    )
VAR FailureRateLastMonth = 
    CALCULATE ( 
        [Failure Rate],
        Dates[Calendar Year Month Number] = ImmediatePriorMonth,
        REMOVEFILTERS ( Dates  )
    )
RETURN
    FailureRateLastMonth

Try to name the Columns in the date table like this:

4 Likes

@deltaselect Thank you very much.

This is what I am after. The last month (no matter what is in the date slicer).

I agree with you - that I don’t believe it adds much value and can easily be seen in a table or line chart. Its a specific request though in this instance.

Thanks again,

Ty

@AntrikshSharma

Thank you for this. It’s not exactly what I was after but still great.

I will use it as it does give the last month based on the furthest date on the right side of the date slicer.

I like how you’ve done it and thank you for the dates table tip.

Cheers,

Ty

@tylaird You’re welcome! I think you should mark @deltaselect’s response as solution then.