Previous 12 months sales by month based on selected slicer values

I am trying to calculate total sales by month year (columns in a matrix) and product (rows) based on two slicer values (year and month) that are synced across multiple pages. All other pages display visuals at the month granularity however on this particular page I need a dynamic rolling 12 months based on the slicers values. I have tried to edit the interaction between the slicers and matrix so the slicers do not actually filter the matrix (to just one month/year) and I have tried unsuccessfully to grab the selected values of the slicers and use those as variables to calculate the previous twelve months worth of sales using datesbetween. At this point I am just going in circles trying things that I have already tried 2-3 times before. Any suggestions?

Hi
That must be really annoying, would you be able to post sample pbix file for reference please
Thanks

Hi @schuhtl,

Not 100% sure this is what you’re looking for but it should get the party started :wink:

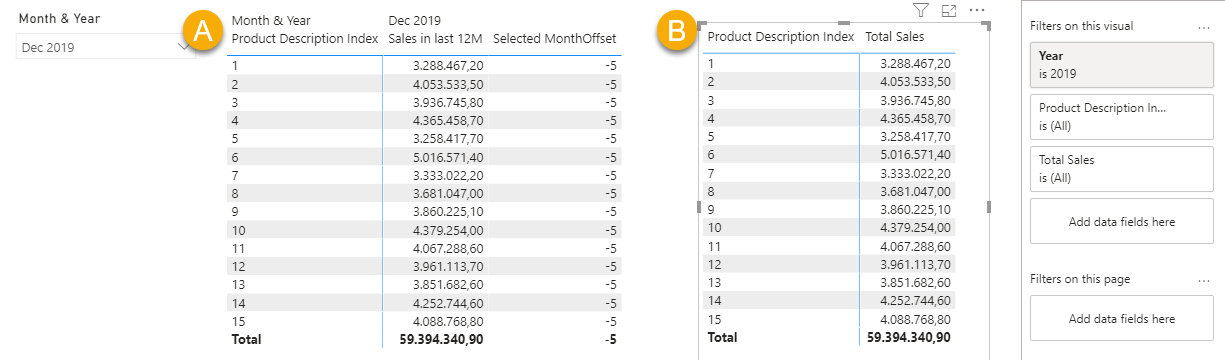
  • Table A, works with the date slicer on Year & Month
  • Table B, doesn’t interact with the date slicer on Year & Month but has a fixed filter in the Filter Pane

Created this measure for Table A

Sales in last 12M = 
VAR myMonthOffset =
    CALCULATE( MAX( Dates[MonthOffset] ),
        ALLSELECTED( Dates[Month & Year] ),
        ALLEXCEPT( Dates, Dates[Month & Year] )
    )
RETURN

CALCULATE( [Total Sales],
    FILTER( ALL(Dates),
        Dates[MonthOffset] >= myMonthOffset -12 &&
        Dates[MonthOffset] <= myMonthOffset
    )
)

.
You can find the M code for the Date table including Offsets here:

I hope this is helpful. Here’s my sample file.
eDNA - Previous 12 months sales.pbix (451.3 KB)

Thank you very much Melissa and NajahS for your willingness to assist me!

Melissa, using your example file I can recreate my issue. I am needing 12 Month & Years as columns going across the top of the matrix. When I use your example, I get something similar to what I was experiencing…matrix A gets filtered to just a single month. Here is an example of what the desired output should look like (the row values are obviously not correct). To get the 12 Month & Year column headers to go across the top of he matrix I had to select the values in the slicer. The challenge (for me) is showing the previous 12 Month & Year columns based on a single slicer selection.

Hi @schuhtl,

Here is what I use for my Rolling Twelve Months in all of my models. I just took @Melissa model and added another measure. Let me know if this works. I also added a date slicer at the top for the Date range you want to see. this works much better in my opinion that the slicer you have in your model.

Just looked and my solution is very similar to @Melissa, just with a different slicer solution. Both of our measures bring back same results.

Total Sales TTM = 
CALCULATE ( 
    [Total Sales],
    DATESINPERIOD( Dates[Date], MAX( Dates[Date]), -12, MONTH))

EDNA - Previous 12 months sales Jarrett.pbix (454.2 KB)

Thanks
Jarrett

1 Like

Hey Jarrett, thanks for taking a look at this for me!

I agree with your date slicer comment however in this case the report/dashboard is used to perform customer reviews so users select various slicer values on page 1 of the report (page 1 is nothing but slicers) and those values sync to all pages (10+ pages). All pages are at the month level except this page and I think it would be confusing to the user to either a.) have an additional slicer on one of the report pages when the other report pages don’t or b.) have month and year slicers that apply to all but one page and an additional date range slicer that only applies to one page. Does that make sense?

@schuhtl,

That makes sense. You could add an additional slicer like I had in my solution to page 1 to let the user know that slicer only affects results on that page. You could also use option B from your reply to my solution.

Thanks
Jarrett

Agreed, however I have to think there is a DAX solution to this issue.

There’s an alternative but that (again) does require a separate Slicer…

I’ve created a separate table for the Month and Year selection. The Month & Year field from this table is then placed within the Slicer on the report page.

MonthSelector = 
SELECTCOLUMNS( Dates,
    "Month & Year", Dates[Month & Year],
    "MonthInYear", Dates[MonthnYear]
)

.
Next updated the measure:

Sales in last 12M v2 = 
VAR myMonthSelection = CALCULATE( MAX( MonthSelector[MonthInYear] ), ALLSELECTED( MonthSelector[Month & Year] ))
VAR myMonthOffset = LOOKUPVALUE( Dates[MonthOffset], Dates[MonthnYear], myMonthSelection)
VAR MonthRange = GENERATESERIES( myMonthOffset -11, myMonthOffset, 1 )
RETURN

IF( VALUES( Dates[MonthOffset] ) IN MonthRange,
    CALCULATE( [Total Sales],
        FILTER( ALL(Dates),
            Dates[MonthOffset] >= SELECTEDVALUE( Dates[MonthOffset]) -12 &&
            Dates[MonthOffset] <= SELECTEDVALUE( Dates[MonthOffset])
        )
    ), BLANK()
)

.
The visual now displays 12 months of data.

I hope this is helpful. Here’s the updated file.
EDNA - Previous 12 months sales v2.pbix (449.0 KB)

1 Like

Melissa, I can make this work…thank you very much! Just curious if it is possible to generate MonthSelector as a measure rather than table? This is actually a SSAS tabular model and I can add it as a table but would prefer not to if there is another options.

Thanks again for your help (Jarrett as well)!

Hi Troy, Power BI doesn’t support using measures as slicers (at this time), the disconnected table trick is the only alternative I’m aware of.

Hi Melissa:

I am building a PBI file for client where the requirement is to select the month from the connected date table slicer with my Fact table and display the Last N months by selecting the month using Single date from the connected Slicer.

I found a similar solution on google from a blog post by “sqljason” (attached solution file), which am trying to replicate in my project file. Since, I have followed all his instructions, but unable to crack where it is going incorrect and need your expertise to understand this logic and get it implemented.

I tried every possible way to find the difference, right from the format of the dates to the DAX measures and not sure if there is any setting/Option which I need to make in my file to get the result similar to the attached solution file.

Show_last12months on Graph by SQLJason.pbix (111.0 KB)

http://sqljason.com/2018/03/display-last-n-months-selected-month-using-single-date-dimension-in-power-bi.html?unapproved=39899&moderation-hash=47eeb966271ff0772aeb654dd5925964#comment-39899

Thank you

Best regards
Afzal

Hi @afzalshariff,

Welcome to the Forum!

Without something to look at it will be hard to help you figure out what the problem might be… So can you share a work in progress file? Your data might be confidential but you can easily swap out your actual data with a sample from the portal, for example this one that contains a Sales table.

And please create a new topic.
Thank you!

Hi Melisa:

Thanks for the quick response.
I will create a sample data and post it as a new topic.

Best Regards
Afzal

1 Like

Hi Melissa,

Thank you so much for guiding us with your great suggestions. Can you please help me with one of the issues I am struggling with the date between slicer default to last 12 months ?

Issue : I need to create a report with date between filter, it should be defaulted to last 12 months in the slicer earlier and later user can change the timeframe to verify the other years data. User is not willing to have the relative date filter to select last 12 months because they want to see the complete date range and select the data. If I create any other date slicer it is cross filtering. Kindly help me.

image

In this filter they should see the last 12 months default filter dynamically based on today’s date. Later they can change the slicer values when we click reset filter it should be defaulting to today’s date - last months date range.

Thanks in advance.

Cheers,
TS

Can someone please help me on this last 12 months issue ?

Hi All,

Can someone please help me with one of the issues I am struggling with the date between slicer default to last 12 months ?

Issue : I need to create a report with date between filter, it should be defaulted to last 12 months in the slicer earlier and later user can change the timeframe to verify the other years data. User is not willing to have the relative date filter to select last 12 months because they want to see the complete date range and select the data. If I create any other date slicer it is cross filtering. Kindly help me.

image

In this filter they should see the last 12 months default filter dynamically based on today’s date. Later they can change the slicer values when we click reset filter it should be defaulting to today’s date - last months date range.

Thanks in advance.

Cheers,
TS