Power Query Workout 10 - Eliminate Returns

Difficulty Rating:

Introduction:

You work on a detailed sales report showing all sales transactions and also returns transactions.
As you can see each line of the sales report has a unique Sales ID, so you can not match the returns and their corresponding sales by the ID_Sales value. :unamused:
You can identify the returns by the negative number in the Qty column and the objective is to find the same product with the same positive Qty and eliminate it in the final result.
As a basic condition you can return goods only after the sales, so you need to make sure that the date of the sales line you take out is before the date of the return line.
If you have multiple possible sales matches try to eliminate the sales line with the nearest date to the return date. [e.g. in the picture below the bold line with 07.03.2023, but in case that is tood difficult, you can also eliminate the other line with 02.03.2023]

Your task:
Eliminate all lines with returns and their corresponding sales lines. If possible, eliminate the sales line with the latest date.

(NOTE: For more advanced users, attempt to minimize the number of manual changes using relevant M code functions)

10 Eliminate Returns.xlsx (18.5 KB)

This workout was posted on Monday May 29, 2023, and the author’s solution will be posted on Sunday June 04, 2023.

5 Likes

Very fun challenge :heart::blush::+1:

Summary
let
    Source = Table.Buffer(Excel.CurrentWorkbook(){[Name="Data"]}[Content]),
    Ans = List.Accumulate( Table.SelectRows(Source,each [Qty]<0)[ID_Sales], Source, (s,l)=> 
        let r= Source{[ID_Sales= l]} , x = List.Last(Table.SelectRows(s, each [Date]< r[Date] and [ID_Product] = r[ID_Product] and [Qty] =-r[Qty])[ID_Sales]) in 
        Table.SelectRows(s, each [ID_Sales] <> x and [ID_Sales] <> l)  )
in
    Ans
6 Likes

This is very nice!

I’m trying to see if I can do this without recursion but those Reeboks make it difficult.

2 Likes

Another Method

Summary
let
    Source = Excel.CurrentWorkbook(){[Name="Data"]}[Content],
    AQ = Table.AddColumn(Source,"Q", each Number.Abs([Qty])),
    Grouped = Table.Group(AQ, {"ID_Product","Q"}, {"T", (A)=> Table.SelectRows(A,each 
        let Q = Table.SelectRows(A, (a)=> a[ID_Sales]>=[ID_Sales])[Qty] in
        [Qty]>0 and not List.Contains(List.Accumulate(Q,{},(s,l)=> s& {List.Last(s,0)+l}),0))}),
            Sort = Table.Sort(Table.RemoveColumns(Table.Combine(Grouped[T]),"Q"),"Date")
in
    Sort
4 Likes

Adjunto mi query…

Summary

let
Source = Excel.CurrentWorkbook(){[Name=“Data”]}[Content],
Group = Table.FromRecords(List.Combine(Table.Group(Source, {“Product”}, {{“All”, each
let
a = _,
b = Table.ToRows(a),
c = List.Accumulate({0…Table.RowCount(a)-1}, {}, (s,c)=>
if a{c}[Qty] > 0 then s&{a{c}} else
if Table.RowCount(a) < 2 then a{0} else
List.Select(s, each _ <> List.Last(List.Select(s, each [Date] < a{c}[Date] and [Qty] = Number.Abs(a{c}[Qty])))))
in c}})[All])),
Sol = Table.Sort(Group,{{“ID_Sales”, Order.Ascending}})
in
Sol

4 Likes

Bo, te felicito, eres impresionante!!! Tu nivel está fuera de cualquier rango. Haces ver el reto fácil, aunque, la verdad, no lo es. La comunidad está aprendiendo muchísimo con tus querys y fórmulas…

4 Likes

Great job :+1::+1:

@Matthias,

Incredibly fun, well-designed problem!

I literally held my breath before hitting return on the key step in this code… :sweat_smile:

Click for M Code

let
    Source = Table.TransformColumnTypes( Excel.CurrentWorkbook(){[Name="Data"]}[Content], {"Date", Date.Type}),
    Purchases = Table.SelectRows( Source, each [Qty] > 0),
    GroupPurchases = Table.Group(Purchases, {"ID_Product", "Product", "Qty"}, {{"All", each _, type table [ID_Sales=number, Date=nullable date, ID_Product=number, Product=text, Qty=number, Unit Value=number, Value Total=number]}}),
    DateSortP = Table.TransformColumns(GroupPurchases, {"All", each Table.Sort(_, {"Date", Order.Ascending})}),
    AddIndexP = Table.RemoveColumns( Table.AddColumn(DateSortP, "IndexP", each Table.AddIndexColumn([All], "IndexP", 1, 1)), "All"),
    ExpandP = Table.ExpandTableColumn(AddIndexP, "IndexP", {"ID_Sales", "Date", "Unit Value", "Value Total", "IndexP"}, {"ID_Sales", "Date", "Unit Value", "Value Total", "IndexP.1"}),
    Returns = Table.SelectRows( Source, each [Qty] < 0),
    GroupReturns = Table.Group(Returns, {"ID_Product", "Product", "Qty"}, {{"All", each _, type table [ID_Sales=number, Date=nullable date, ID_Product=number, Product=text, Qty=number, Unit Value=number, Value Total=number]}}),
    DateSortR = Table.TransformColumns(GroupReturns, {"All", each Table.Sort(_, {"Date", Order.Ascending})}),
    AddIndexR = Table.RemoveColumns( Table.AddColumn(DateSortR, "IndexR", each Table.AddIndexColumn([All], "IndexR", 1, 1)), "All"),
    ExpandR = Table.PrefixColumns( Table.ExpandTableColumn(AddIndexR, "IndexR", {"ID_Sales", "Date", "Unit Value", "Value Total", "IndexR"}, {"I.ID_Sales", "I.Date", "I.Unit Value", "I.Value Total", "I.IndexR"}), "R*"),
    AbsValQtyR = Table.TransformColumns(ExpandR,{{"R*.Qty", Number.Abs, type number}}),
    RemColsR = Table.RemoveColumns(AbsValQtyR,{"R*.I.ID_Sales", "R*.I.Unit Value", "R*.I.Value Total"}),
    Join = Table.Join( ExpandP, {"ID_Product", "Qty", "IndexP.1"}, RemColsR, {"R*.ID_Product", "R*.Qty", "R*.I.IndexR"}, JoinKind.LeftOuter),
    RemoveReturns = Table.SelectRows(Join, each ([#"R*.I.Date"] = null)),
    RemHelperCols = Table.RemoveColumns(RemoveReturns,{"IndexP.1", "R*.ID_Product", "R*.Product", "R*.Qty", "R*.I.Date", "R*.I.IndexR"}),
    ReorderCols = Table.ReorderColumns(RemHelperCols,{"ID_Sales", "Date", "ID_Product", "Product", "Qty", "Unit Value", "Value Total"}),
    SortRows = Table.Sort(ReorderCols,{{"ID_Sales", Order.Ascending}})

in
    SortRows

Thanks for a fantastic challenge!

  • Brian
2 Likes

Amazing solution, @borydobon !

When I first looked at this, I thought “where’s the rest of the code?” :laughing:

3 Likes

How to copy this M code to refer am getting
Expression.Error: We couldn’t find an Excel table named ‘Data’.
any one please help.

@haswanthkumarstudyma if you download the file in the task above you will find a table with the name Data plus a basic query to this table:

Summary
let
Fonte = Data,
    adc = Table.AddColumn(Fonte, "ID", each if [Qty] <0 then Text.From([ID_Product])& Text.From([Qty]) else Text.From([ID_Product])&"-"&Text.From([Qty])),
gp = Table.Group(adc, {"ID"}, {{"Contagem", each
[
a = _,
b = Table.Group(a, {"ID"}, {{"Todos", each Table.AddIndexColumn(_, "Ind",0,1)},{"Count", each {1} & List.Repeat({0},Table.RowCount(_)-1)}})[[Todos],[Count]] ,
c = Table.Skip(Table.SelectRows(_, each [Qty] >=0),Table.AddColumn(a,"Val", each Table.RowCount(Table.SelectRows(a, each [Qty] <0)))[Val]{0}),
d = List.Count(a[Qty])-1,
e = if (a[Qty]{0} < 0 or a[Qty]{d} < 0) then b else c
][e]
}})[[Contagem]],
    ad = Table.AddColumn(gp, "Personalizar", each 
let
    add = Table.AddColumn([Contagem], "Teste", each [Todos]),
    exp = Table.ExpandTableColumn(add, "Todos", Table.ColumnNames(add[Teste]{0}) ),
    ad = Table.AddColumn(exp, "Personalizar", each [Count]{[Ind]}),
    fil = Table.SelectRows(ad, each ([Personalizar] = 1))
in
 try Table.RemoveColumns(fil,{"Ind","Count","Teste","Personalizar"}) otherwise [Contagem] )[[Personalizar]],
    exp = Table.ExpandTableColumn(ad, "Personalizar", Table.ColumnNames(Fonte)),
    res = Table.Sort(exp,{{"ID_Sales", Order.Ascending}})
in
    res
1 Like

Hello,
I tried my best… but I don’t think my solution is very robust for all situations. I am eager to see what the others have done!
Thanks for the fun challenge!

Summary

let
Source = ExcelW10,
#“Add Return Type” = Table.AddColumn(Source, “Type”, each if [Qty]<0 then true else false,type logical),
RETURNS = Table.SelectRows(#“Add Return Type”,each [Type]=true),
#“Grouped Rows” = Table.Group(RETURNS, {“ID_Product”,“Qty”}, {{“All”, each _, type table [ID_Sales=nullable number, Date=nullable date, ID_Product=nullable number, Product=nullable text, Qty=nullable number, Unit Value=nullable number, Value Total=nullable number, Type=logical, Abs Qty=number]}}),
Fin_RETURNS = Table.RemoveColumns(Table.Combine(Table.AddColumn(#“Grouped Rows”, “Rank”, each Table.AddRankColumn([All],“Rank”,{“Date”,Order.Descending},[RankKind=RankKind.Competition]))[Rank]),“Type”),
SALES = Table.RemoveColumns(Table.SelectRows(#“Add Return Type”,each [Type]=false),“Type”),
#“Grouped Rows1” = Table.Group(SALES, {“ID_Product”,“Qty”}, {{“All”, each _, type table [ID_Sales=nullable number, Date=nullable date, ID_Product=nullable number, Product=nullable text, Qty=nullable number, Unit Value=nullable number, Value Total=nullable number, Type=logical, Abs Qty=number]}}),
Fin_SALES = Table.Combine(Table.AddColumn(#“Grouped Rows1”, “Rank”, each Table.AddRankColumn([All],“Rank”,{“Date”,Order.Descending},[RankKind=RankKind.Competition]))[Rank]),
Custom2 = Table.AddColumn(Fin_RETURNS,“Corr. Sales”,each try Table.SelectRows(Fin_SALES,(x)=> x[ID_Product]=[ID_Product] and x[Date]<[Date] and x[Qty]=Number.Abs([Qty]))[[Date],[ID_Sales]]{[Rank]-1} otherwise Table.SelectRows(Fin_SALES,(x)=> x[ID_Product]=[ID_Product] and x[Date]<[Date] and x[Qty]=Number.Abs([Qty]))[[Date],[ID_Sales]]{0}),
Sales_Removal_List = Table.ExpandRecordColumn(Custom2, “Corr. Sales”, {“Date”, “ID_Sales”}, {“Corr. Sales Date”, “Corr. Sales ID_Sales”})[Corr. Sales ID_Sales],
Custom1 = Table.Sort(Table.SelectRows(SALES,each not List.Contains(Sales_Removal_List,[ID_Sales])),“ID_Sales”)
in
Custom1

2 Likes

This workout is tasking and tricking.:unamused::unamused: Been on it for days now and couldn’t solve it. I await the solution from @matthias

2 Likes

Hello,
thanks to everyone who participated! I’d say for this tricky workout everyone who tried it is a winner.

If you are looking for a super short solution, then check out @borydobon. I will as ever try to spill out an accessible step by step solution. I just use two advanced elements: GroupKind.Local in a grouping step plus a one-step shifting technique.

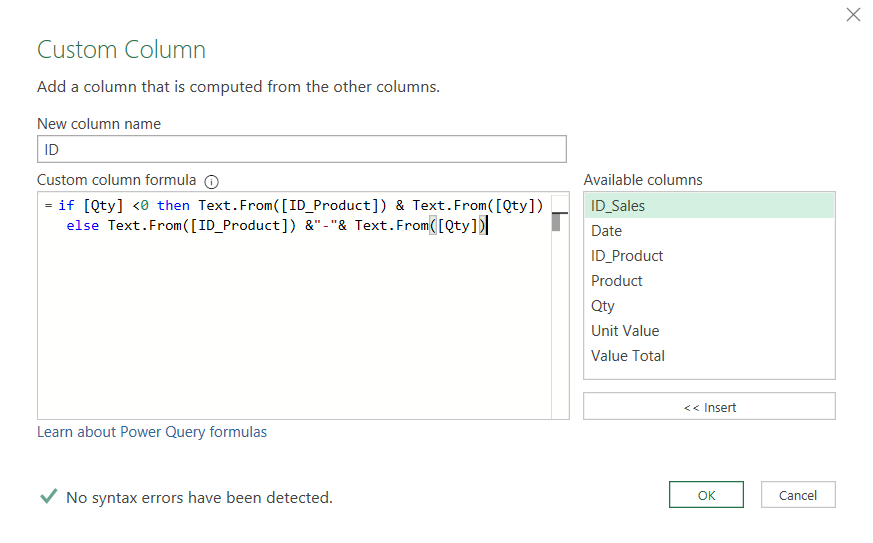
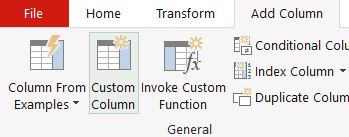
Let’s start off on the Add Column tab with a Custom Column:
image
We call it ID and use this formula to build an ID:
if [Qty] <0 then Text.From([ID_Product]) & Text.From([Qty]) else Text.From([ID_Product]) &“-”& Text.From([Qty])

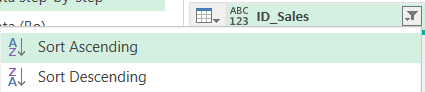
Then we sort the ID column and Date column ascending:
= Table.Sort(#“Added ID”,{{“ID”, Order.Ascending}, {“Date”, Order.Ascending}})

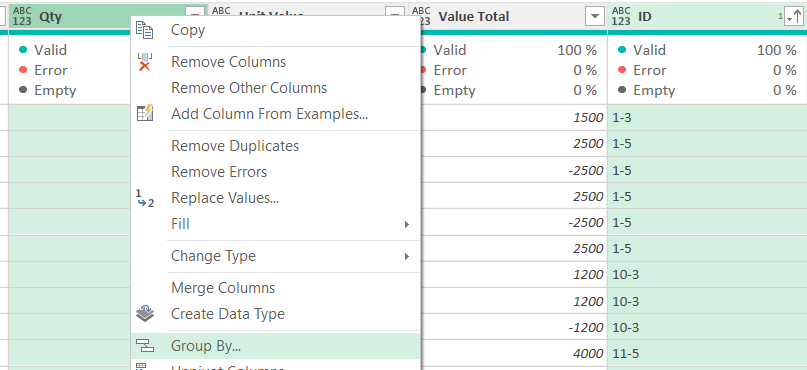
Next, we mark first the ID column and then the Qty column and select on the Home tab the Group By button. Alternatively make a right mouse click and select Group By:


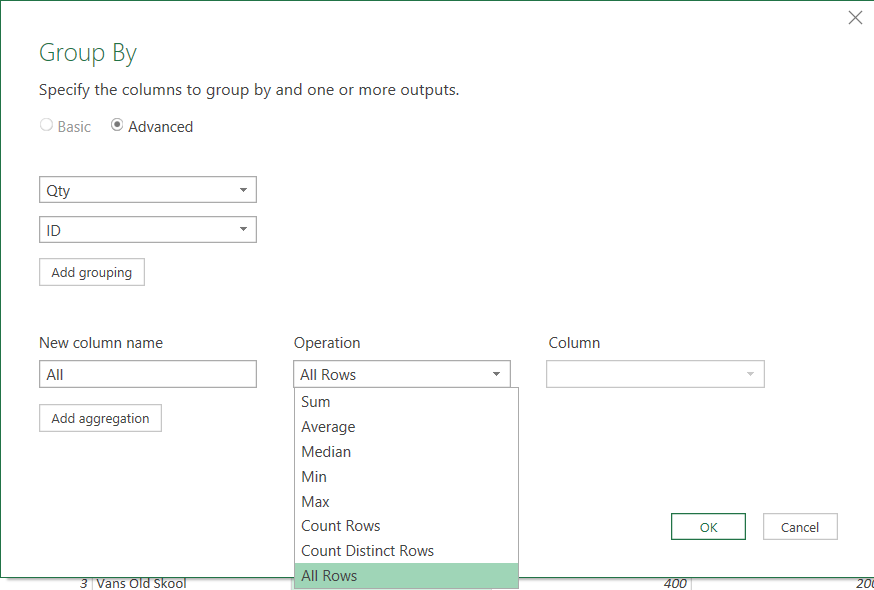
As New Column name take e.g. All and as Operation take All Rows:

In the formula bar add , GroupKind.Local at the end:


This will make sure that we keep all sales and return sequences and do not group them together.

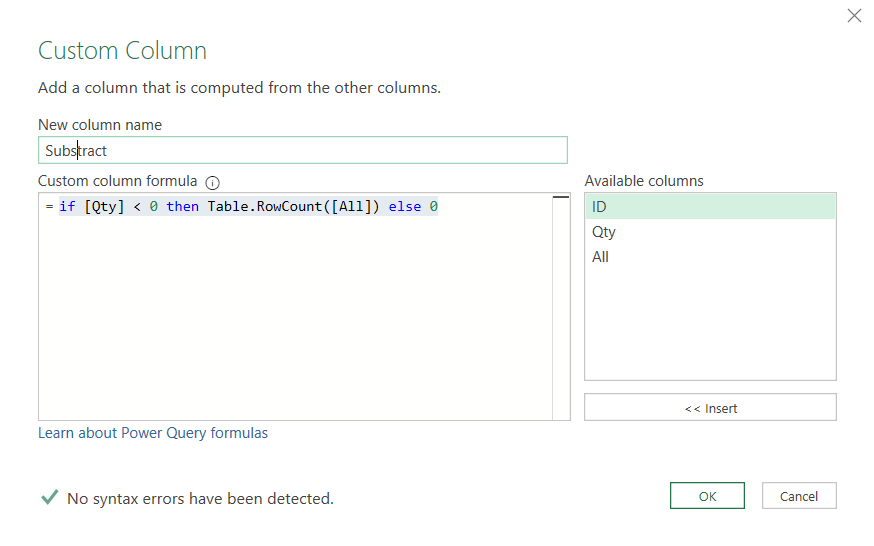
Now let’s add another Custom Column called “Substract” with this simple formula:
if [Qty] < 0 then Table.RowCount([All]) else 0

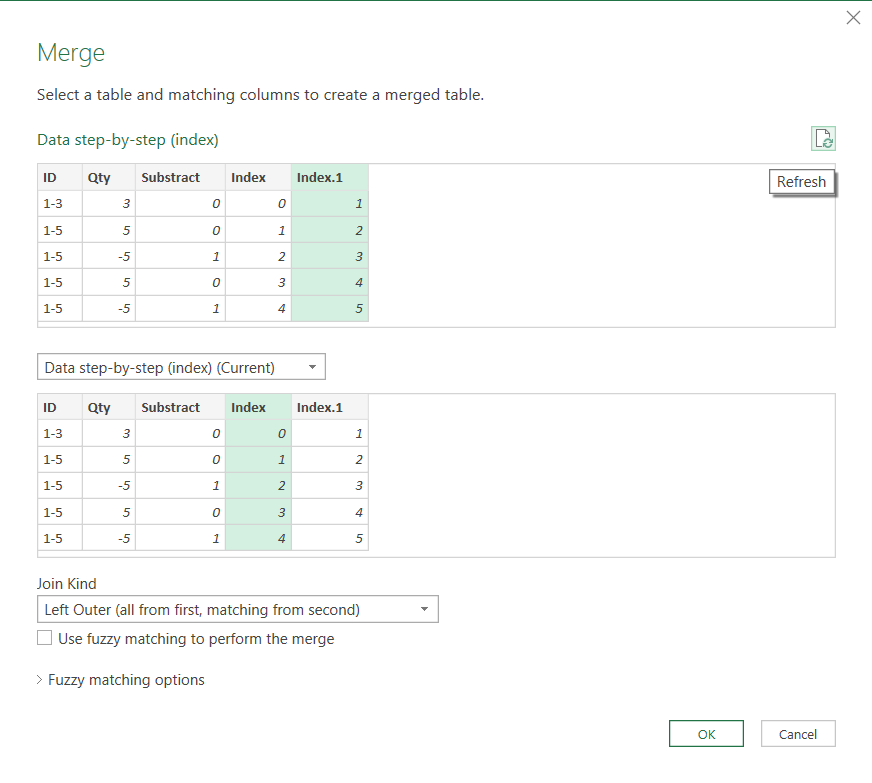
Let’s try to shift this up by one row. We could add a 0 based Index and a 1 based index and then merge the table with itself. Instead, we use a more advanced one step shifting technique from Imke Feldmann.
By pressing on fx left of the formula bar we add a custom step, and we add this formula:
= Table.FromColumns(
Table.ToColumns(#“Added Substract”) & {List.Skip(#“Added Substract”[Substract]) & {0}},
Table.ColumnNames(#“Added Substract”) & {“SubstractShifted”} )

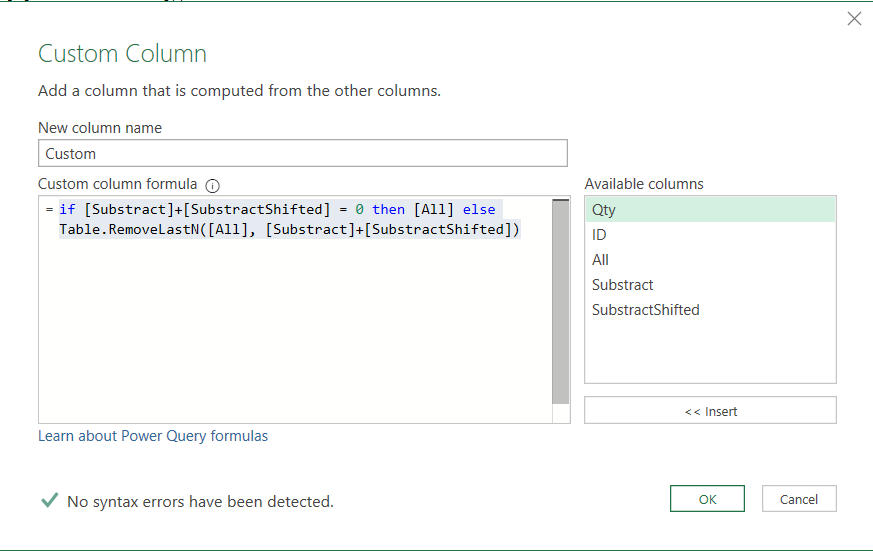
We add a third Custom Column with this formula:
if [Substract]+[SubstractShifted] = 0 then [All] else Table.RemoveLastN([All], [Substract]+[SubstractShifted])


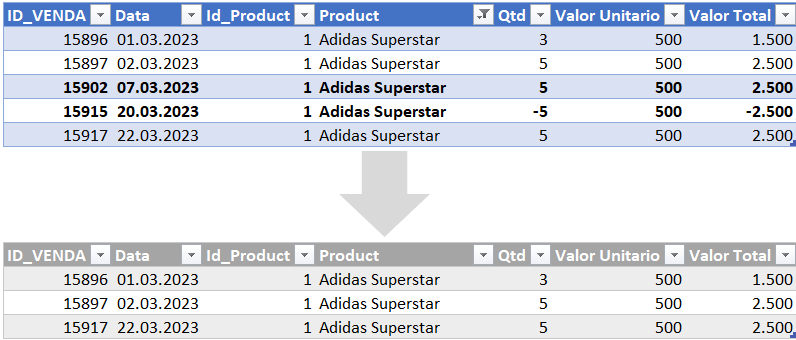
The formula will make sure that we remove the number of returns from the end of the sales tables (taking out the last sales lines) and also from the return tables (making them empty).

As the table of the Custom column includes all relevant columns we write at the end of the formula [[Custom]] to only keep the Custom column:

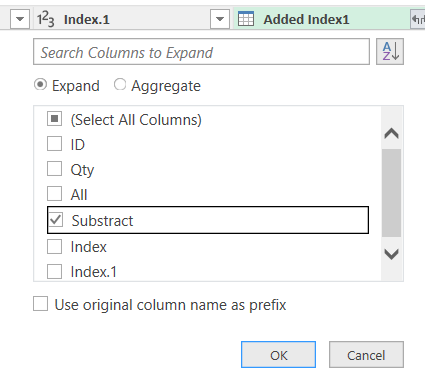
Let’s click on the expand symbol on the top right and deselect ID and there is no prefix needed:
image

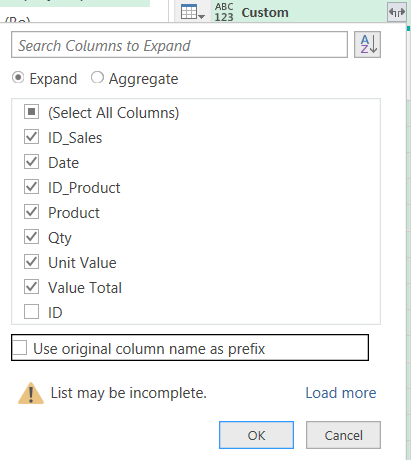
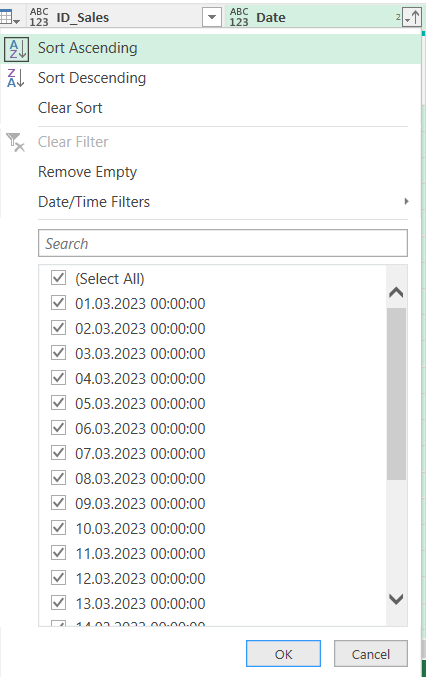
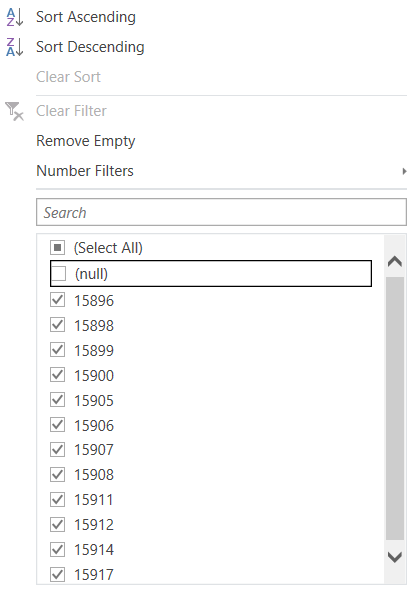
Click on the top right triangle of any of the columns and deselect null to filter out all empty rows:

Finally mark the ID_Sales column and sort it ascending:
image

let
    Source = Excel.CurrentWorkbook(){[Name="Data"]}[Content],
    #"Added ID" = Table.AddColumn(Source, "ID", each if [Qty] <0 then Text.From([ID_Product])& Text.From([Qty]) else Text.From([ID_Product])&"-"&Text.From([Qty])),
    #"Sorted Rows" = Table.Sort(#"Added ID",{{"ID", Order.Ascending}, {"Date", Order.Ascending}}),
    #"Grouped Rows" = Table.Group(#"Sorted Rows", {"Qty", "ID"}, {{"All", each _, type table [ID_Sales=number, Date=datetime, ID_Product=number, Product=text, Qty=number, Unit Value=number, Value Total=number, ID=text]}}, GroupKind.Local),
    #"Added Substract" = Table.AddColumn(#"Grouped Rows", "Substract", each if [Qty] < 0 then Table.RowCount([All]) else 0),
    Shifted = Table.FromColumns(
        Table.ToColumns(#"Added Substract") & {List.Skip(#"Added Substract"[Substract]) & {0}},
        Table.ColumnNames(#"Added Substract") & {"SubstractShifted"} ),
    #"Added Custom" = Table.AddColumn(Shifted, "Custom", each if [Substract]+[SubstractShifted] = 0 then [All] else Table.RemoveLastN([All], [Substract]+[SubstractShifted]))[[Custom]],
    #"Expanded Custom" = Table.ExpandTableColumn(#"Added Custom", "Custom", {"ID_Sales", "Date", "ID_Product", "Product", "Qty", "Unit Value", "Value Total"}, {"ID_Sales", "Date", "ID_Product", "Product", "Qty", "Unit Value", "Value Total"}),
    #"Filtered Rows" = Table.SelectRows(#"Expanded Custom", each ([ID_Sales] <> null)),
    #"Sorted Rows1" = Table.Sort(#"Filtered Rows",{{"ID_Sales", Order.Ascending}})
in
    #"Sorted Rows1"

Could it be done shorter? Yes, but for a great deal, this step-by-step approach is UI supported and most formulas should be relatively easily understandable.

The one-step shifting technique is advanced but very useful and you can learn it as a pattern. In any case you can also use the more beginner friendly merge against itself technique with two index columns as alternative.

Try it out and make sure to check the other approaches above! => Hope you learn something!

Big thanks to everyone who has blurred or hidden the details! I have taken this now out so that it’s easier to compare solutions.

2 Likes

OK, the above one-step shift might be too complex for you. So here is the proof, that you can have UI support on all steps, with the shift build with a 0 based Index and a 1 based Index and merging against itself:
After adding the two index columns merge the table against itself. => select …(Current). And as we want to shift the Substract column upwards, we select above the 1 based Index and below the 0 based Index:

When expanding we only need the Substract column:
image

I change the name in the formula bar to SubstractShifted, so that it fits into the above created code:

let
    Source = Excel.CurrentWorkbook(){[Name="Data"]}[Content],
    #"Added ID" = Table.AddColumn(Source, "ID", each if [Qty] <0 then Text.From([ID_Product])& Text.From([Qty]) else Text.From([ID_Product])&"-"&Text.From([Qty])),
    #"Sorted Rows" = Table.Sort(#"Added ID",{{"ID", Order.Ascending}, {"Date", Order.Ascending}}),
    #"Grouped Rows" = Table.Group(#"Sorted Rows", {"ID", "Qty"}, {{"All", each _}}, GroupKind.Local),
    #"Added Substract" = Table.AddColumn(#"Grouped Rows", "Substract", each if [Qty] < 0 then Table.RowCount([All]) else 0),
    #"Added Index" = Table.AddIndexColumn(#"Added Substract", "Index", 0, 1, Int64.Type),
    #"Added Index1" = Table.AddIndexColumn(#"Added Index", "Index.1", 1, 1, Int64.Type),
    #"Merged Queries" = Table.NestedJoin(#"Added Index1", {"Index.1"}, #"Added Index1", {"Index"}, "Added Index1", JoinKind.LeftOuter),
    #"Expanded Added Index1" = Table.ExpandTableColumn(#"Merged Queries", "Added Index1", {"Substract"}, {"SubstractShifted"}),
    #"Replaced Value" = Table.ReplaceValue(#"Expanded Added Index1",null,0,Replacer.ReplaceValue,{"SubstractShifted"}),
    #"Added Custom" = Table.AddColumn(#"Replaced Value", "Custom", each if [Substract]+[SubstractShifted] = 0 then [All] else Table.RemoveLastN([All], [Substract]+[SubstractShifted]))[[Custom]],
    #"Expanded Custom" = Table.ExpandTableColumn(#"Added Custom", "Custom", {"ID_Sales", "Date", "ID_Product", "Product", "Qty", "Unit Value", "Value Total"}, {"ID_Sales", "Date", "ID_Product", "Product", "Qty", "Unit Value", "Value Total"}),
    #"Filtered Rows" = Table.SelectRows(#"Expanded Custom", each ([ID_Sales] <> null)),
    #"Sorted Rows1" = Table.Sort(#"Filtered Rows",{{"ID_Sales", Order.Ascending}})
in
    #"Sorted Rows1"

Some more steps, but all steps are relatively easy to understand - you can follow along even if you are not an advanced Power Query user!

1 Like

Such a workout Matthias. I went all in and created a credit ID as well, so that within each Product you can see which credit is matched with which debet. Here is my solution:

Summary
let
    fxCreditID = ( Mytable as table, Mycolumn as text ) => let _List = Table.Column( Mytable, Mycolumn) in 
        List.Generate( 
        () => let x = _List{0} in [ Current = x, Counter = 0, Credit = if x < 0 then 1 else 0], 
        each [Counter] <= List.Count( _List ) -1,
        each let y = _List, next = y{[Counter]+ 1}, cr = [Credit] in [ Current = next, Counter = [Counter] + 1, 
        Credit = ( if next < 0 then + 1 else if cr > 0 and [Current] < 0 then 0 else if cr > 0 then -1  else 0) + cr  ] ,
        each [Credit] ),
    Source = Data,
    ChType = Table.TransformColumnTypes(Source,{{"Date", type date}, {"ID_Sales", Int64.Type}, {"ID_Product", Int64.Type}, {"Qty", Int64.Type}, {"Unit Value", Int64.Type}, {"Value Total", Int64.Type}, {"Product", type text}}),
    AbsValue = Table.AddColumn(ChType, "AbsQty", each Text.From([ID_Product] ) & "|"&Text.From( Number.Abs( [Qty] ) ) ),
    Sort = Table.Sort(AbsValue,{{"AbsQty", Order.Ascending}, {"Date", Order.Descending}}),
    Group = Table.Group(Sort, {"AbsQty"}, 
{{"Details", each Table.FromColumns( Table.ToColumns( _ ) & { fxCreditID(_, "Qty")}, Table.ColumnNames(_) & {"CreditID"} ) , type table [ID_Sales=nullable number, Date=nullable date, ID_Product=nullable number, Product=nullable text, Qty=nullable number, Unit Value=nullable number, Value Total=nullable number, AbsQty=text, CreditID = Int64.Type ]}})[[Details]],
    Exp = Table.ExpandTableColumn(Group, "Details", {"ID_Sales", "Date", "ID_Product", "Product", "Qty", "Unit Value", "Value Total", "CreditID"}, {"ID_Sales", "Date", "ID_Product", "Product", "Qty", "Unit Value", "Value Total", "CreditID"}),
    Filter = Table.SelectRows(Exp, each [CreditID] = 0),
    SortID = Table.Sort(Filter,{{"ID_Sales", Order.Ascending}})

  
in
    SortID
2 Likes

Wowa, that’s a very short solution. Good job Borydobon. I approached it with List.Generate, also creating an ID for each credit. Curious what you think :wink:

1 Like

I use List.Accumulate
list is ID_Sales with negative Qty
seed is the whole table then remove ID_Sales with negative Qty and latest ID_Sales with same ID_Product and same Qty.

Using ID for grouping the same ID_Product and same ABS(Qty) is faster as we don’t have to filler the whole table

let
    Source = Excel.CurrentWorkbook(){[Name="Data"]}[Content],
    Gr = Table.Group(Table.AddColumn(Source, "Gr", each [ID_Product]*100000+Number.Abs([Qty])),"Gr",{"T", each 
        List.Accumulate(Table.SelectRows(_,each [Qty]<0)[ID_Sales], _, (s,l)=> 
        let x = List.Last(Table.SelectRows(s, each [ID_Sales]< l and [Qty]>=0)[ID_Sales]) in 
        Table.SelectRows(s, each [ID_Sales] <> x and [ID_Sales] <> l)) }),
    Ans = Table.RemoveColumns(Table.Sort(Table.Combine(Gr[T]),"Date"),"Gr")
in
    Ans
1 Like