Super work everyone once again.
So impressed by the creativity around quite a complex scenario.
The collaboration here within this thread is off the charts!
Sam
Super work everyone once again.
So impressed by the creativity around quite a complex scenario.
The collaboration here within this thread is off the charts!
Sam
Thank you for your precious feed back. Yes I agree with you when more icons on the report, it’s better to
to have ability to know what are they. I will keep this in my mind for the next challenge.
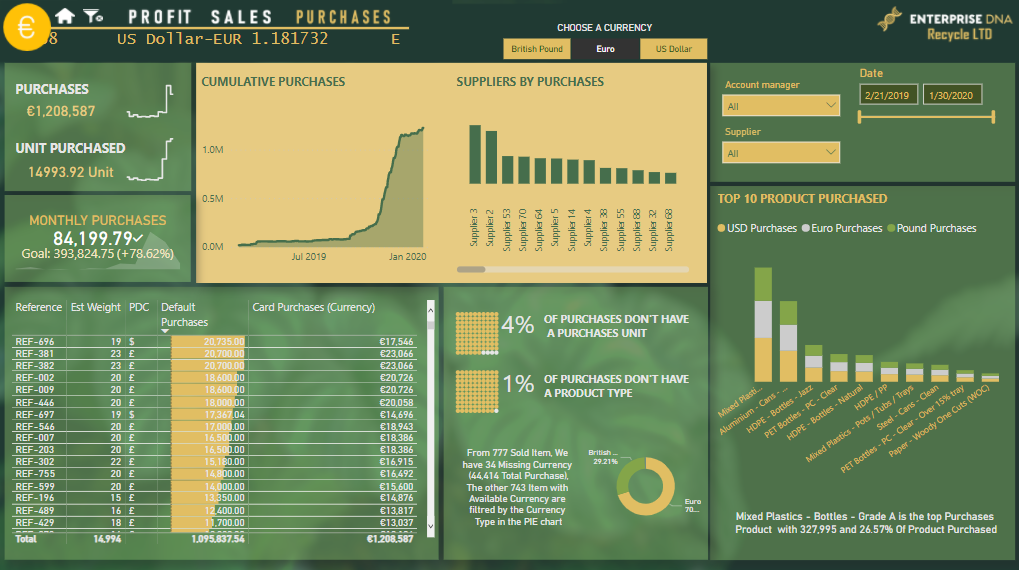
Hi all
This is my submission.
When I saw the challenge I though, now I have the possiblity to learn how to calculate with currency. And Indeed, there was a lot of currency.
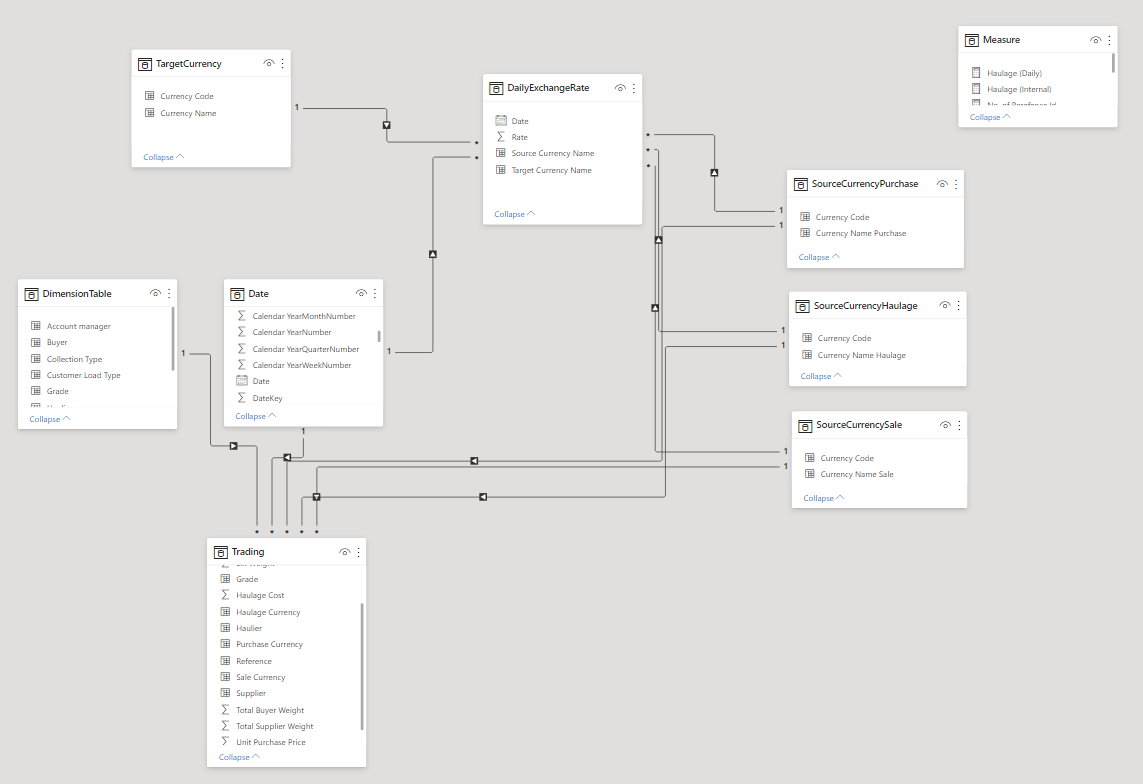
Out from the model in the description I build my model with the three currency tables, which relate to the three amounts Purchase, Haulage and Sale. This solution helps me a lot.
I calculated the new currency on the date (Delivery Date).
Created a currency table Where | Pund to USD | Pund to EURO | EURO to USD | EURO to Pound | USD to Pound| USD to EURO.
When I worked through, I realized that when Purchase-Pound, Haulage-Pound and Sale-EURO on the same row. When calculate Purchase and Haulage to EURO I did not get Sale- EURO to EURO. I handled this by expanding the currency table with the three currency. Where the rate was 1 for EURO to EURO | Pound to Pound | USD to USD |.
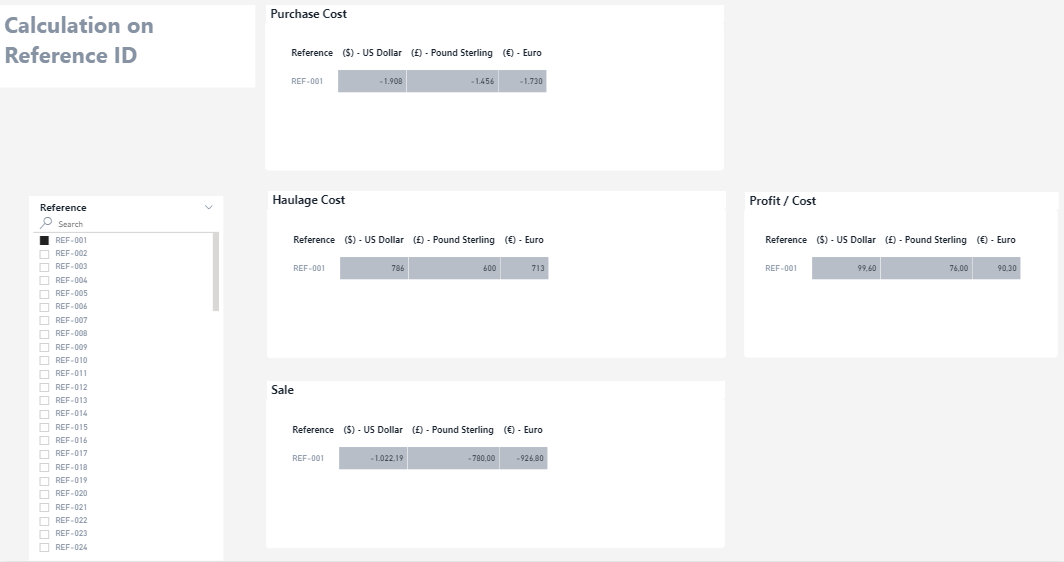
Example on a calculation for Ref-001 just for one quantity.
Sale -60
Purchase -112
Haulage 600
Formula= Sale – Purchase – Haulage
Result = -60 – (-112 + 600)= -548
In my calculations I only used Est. Weight
PBIX file: Challenge 9 Currency calculation.pbix (317.6 KB)
This is my submission to EDNA Powerbi Challenge 9 - pbix file attached below:
EDNA Challenge 9_Mohammed Ali.pbix (600.6 KB)
Hi everyone,
This is my submission to Power BI Challenge 9 - Currency Conversion and More.
Great Report @Amdi.
Nothing wrong with your approach to the modelling as you stated the key is to add a new technique to your armoury which you have done in a way that makes sense to you.
I always like to go by the mantra make it work and then make it sexy. Once you understand a topic and all the necessary quirks you can then look to optimise and improve.
Nice work!
Thanks,
Haroon
Another awesome submission @Mohammed_ali.
Looking forward to diving in and exploring the analysis.
Thanks,
Haroon
Wow! Welcome to the challenge @Rachwen_Mesbehi a remarkable entry.
I had a little look at this when it came into the inbox, some impressive work and techniques deployed.
Thank you for posting it to the forum.
Really looking forward to reading your writeup and seeing more of your work.
Thanks,
Haroon
Firstly, thanks to the Team at DNA for creating such an interesting, real world challenge.
The challenge explores a common business problem where you have a single entity transacting in various currencies but required to consolidate the transactions and report in each currency separately.
The first problem was deciding on how to translate the currency. I didn’t think it would be appropriate to use a single rate and apply this to the model as this would be unrealistic and result in some difficult conversations with the tax authorities, too.
The common practice in finance is to use an average rate for the reporting period and aggregate your sales. In order to get the rates, I created a custom function in the Query editor, as below:
(Source = Web.BrowserContents(“https://www.x-rates.com/average/?from=EUR&to=“&Currency&”&amount=1&year=2019”)
Although this worked fine, I was still confined to altering the function manually to swap the home and target currencies around. This led to an explosion of functions in the query editor, which I wasn’t too happy about. So, if anyone has a solution for this, I would be incredibly grateful to hear from them. At the moment, I believe the answer is to create a list in the function but I’m still exploring a solution to that problem.
Coming from a management accounting background and being a heavy Excel user, the visualisation aspect is something that I struggle with, and this is what I hoped to overcome by taking part in the challenge. To be perfectly honest, the tables that I have in the report along with the rates table would have satisfied most reporting and compliance requirements, Nevertheless, Power BI is about so much more than just tables of formulated data. Looking at the other entries to the challenge I still have some work to do in overcoming that hurdle and I’m looking forward to the next challenge to improve on the visualisation aspects of my reports… Thanks again for a great challenge.
Thank you for your reply @haroonali1000, appriciate it.
I know my visualization has a limit of info. I also feel I shall develop more creativity.
I still work to figure out what is relevant information and how much shall I present. When enough is enough.
I also think there must be a rule for how busy the canvas may be and small vizualization.
I appriciate all the submission. Some of the submission is art and really beautifull
/Amdi
Hi @Craig. it was my first time with currencies, but I leveraged the eDNA resources and believe I have it cracked to use daily rates, a transaction currency, a base currency, and a display currency (other forum members with more experience in currency conversion will comment, I’m sure…). You can see my (incomplete) submission in post 23 of this thread.
Hope it helps.
Greg
Hello @Craig ,
For me I downloaded a currency rate Excel sheets from ExcelRates.com for each currency rates referencing the minimum date and Max date from the source table ( ‘01/01/2019’ and ‘02/28/2020’ respectively ).
Then I merged all the currency rates tables and unpivoted the columns which gave me currency rates from one currency to another for each day.
For the all the sales DAX calculations, I used average rate for all the dates and each currency rate.
( not sure if that’s how it should be calculated hope others will give more insight )
Thanks
Hi Greg & Reba
Thanks for the comments. Most currencies are fortunately quite stable and so to simplify currency translation HMRC here in the UK, calculates and permits the use of an average monthly exchange rate. Unfortunately their site isn’t Power Query friendly.
As I am sure you are aware, just like share prices. Currency rates will fluctuate throughout the day and it would be easy to find yourself in a situation where determining the “correct” rate would be like trying to nail jelly to a wall.
My problem surrounding the challenge and the currency rates was specifically to do with the Query editor function that I used to pull the data from the x-rates site. I didn’t like the idea of writing, three functions for 2019 and another three for 2020 and I was hoping there may be a way to avoid this issue. Even though in reality, I did just copy them. Still, it wasn’t a very elegant solution to the problem
In the below, for instance. “&Currency&” referenced a table of all three currencies. So that saved me some time but I had to manually change the ?from=EUR each time I required the next set of rates. Which I found tedious and then, of course, the year as well. Any suggested solutions to this would be very much appreciated.
= (Currency as text) as table =>
let
Source = Web.BrowserContents(“https://www.x-rates.com/average/?from=EUR&to=“&Currency&”&amount=1&year=2019”)
It was a stunning report!!! especially the currency conversion filtering page… I was wondering about the integration options you have done within the report… Can you share PBIX file to understand it more?
Your report is quite exhaustive!!! Can you share PBIX file to understand it more?
Hello @shjuthani ,
You can find all the challenges PIBX file by following the below link.
https://portal.enterprisedna.co/p/power-bi-challenge-submission
P.S. I don’t think the PIBX files for this challenge is uploaded yet. So here it is mine:-
ERD_Waste_Mgt_Analysis.pbix (253.4 KB)
Regards.
Hi @datazoe, I have fallen in love with your work. I am very new to Power BI, and I just started getting my hands dirty with the Challenges. I’d like to go through your PBIX file for Challenge 9, and see how to improve myself. The gems contained in that report are uncountable!
Thank you very much, and I look forward to hearing from you soon.
Hi @alexbadiu, I absolutely love your reports. I am relatively new to Power BI, and I’d really appreciate it if you could send me your PBIX file for Challenge 9.
I believe I’ll be able to learn many things from your report, and hopefully get better at creating more insightful reports.
Hello @sibigbami01, thank you for your feedback!
You can find below links where you can download the pbix files :
From my experience, the best way to learn is to participate to these challenges, even though in the beginning it is not easy. You will find yourself improving really fast!
https://info.enterprisedna.co/power-bi-challenge-9-pbix-files/
Best regards