For this report I wanted to focus on profitability of recycling. I recently read an article about how labeling plastics where terrible for recycling because plastic is so expensive to recycle. Before the labels they would recycle milk jugs at a loss because the other materials made up for it, but once labels were introduced people saw other plastics were the same label as those milk jugs and also included them. So they had much more plastic and no longer did the other materials compensate for the losses of recycling it. I felt a little bad, because I know I felt good about recycling my plastics not realizing how troublesome it was. I’ll find the article and link it later, but here is another one too: https://www.news.ucsb.edu/2020/020072/closing-plastic-loop So now I could look at it with data.
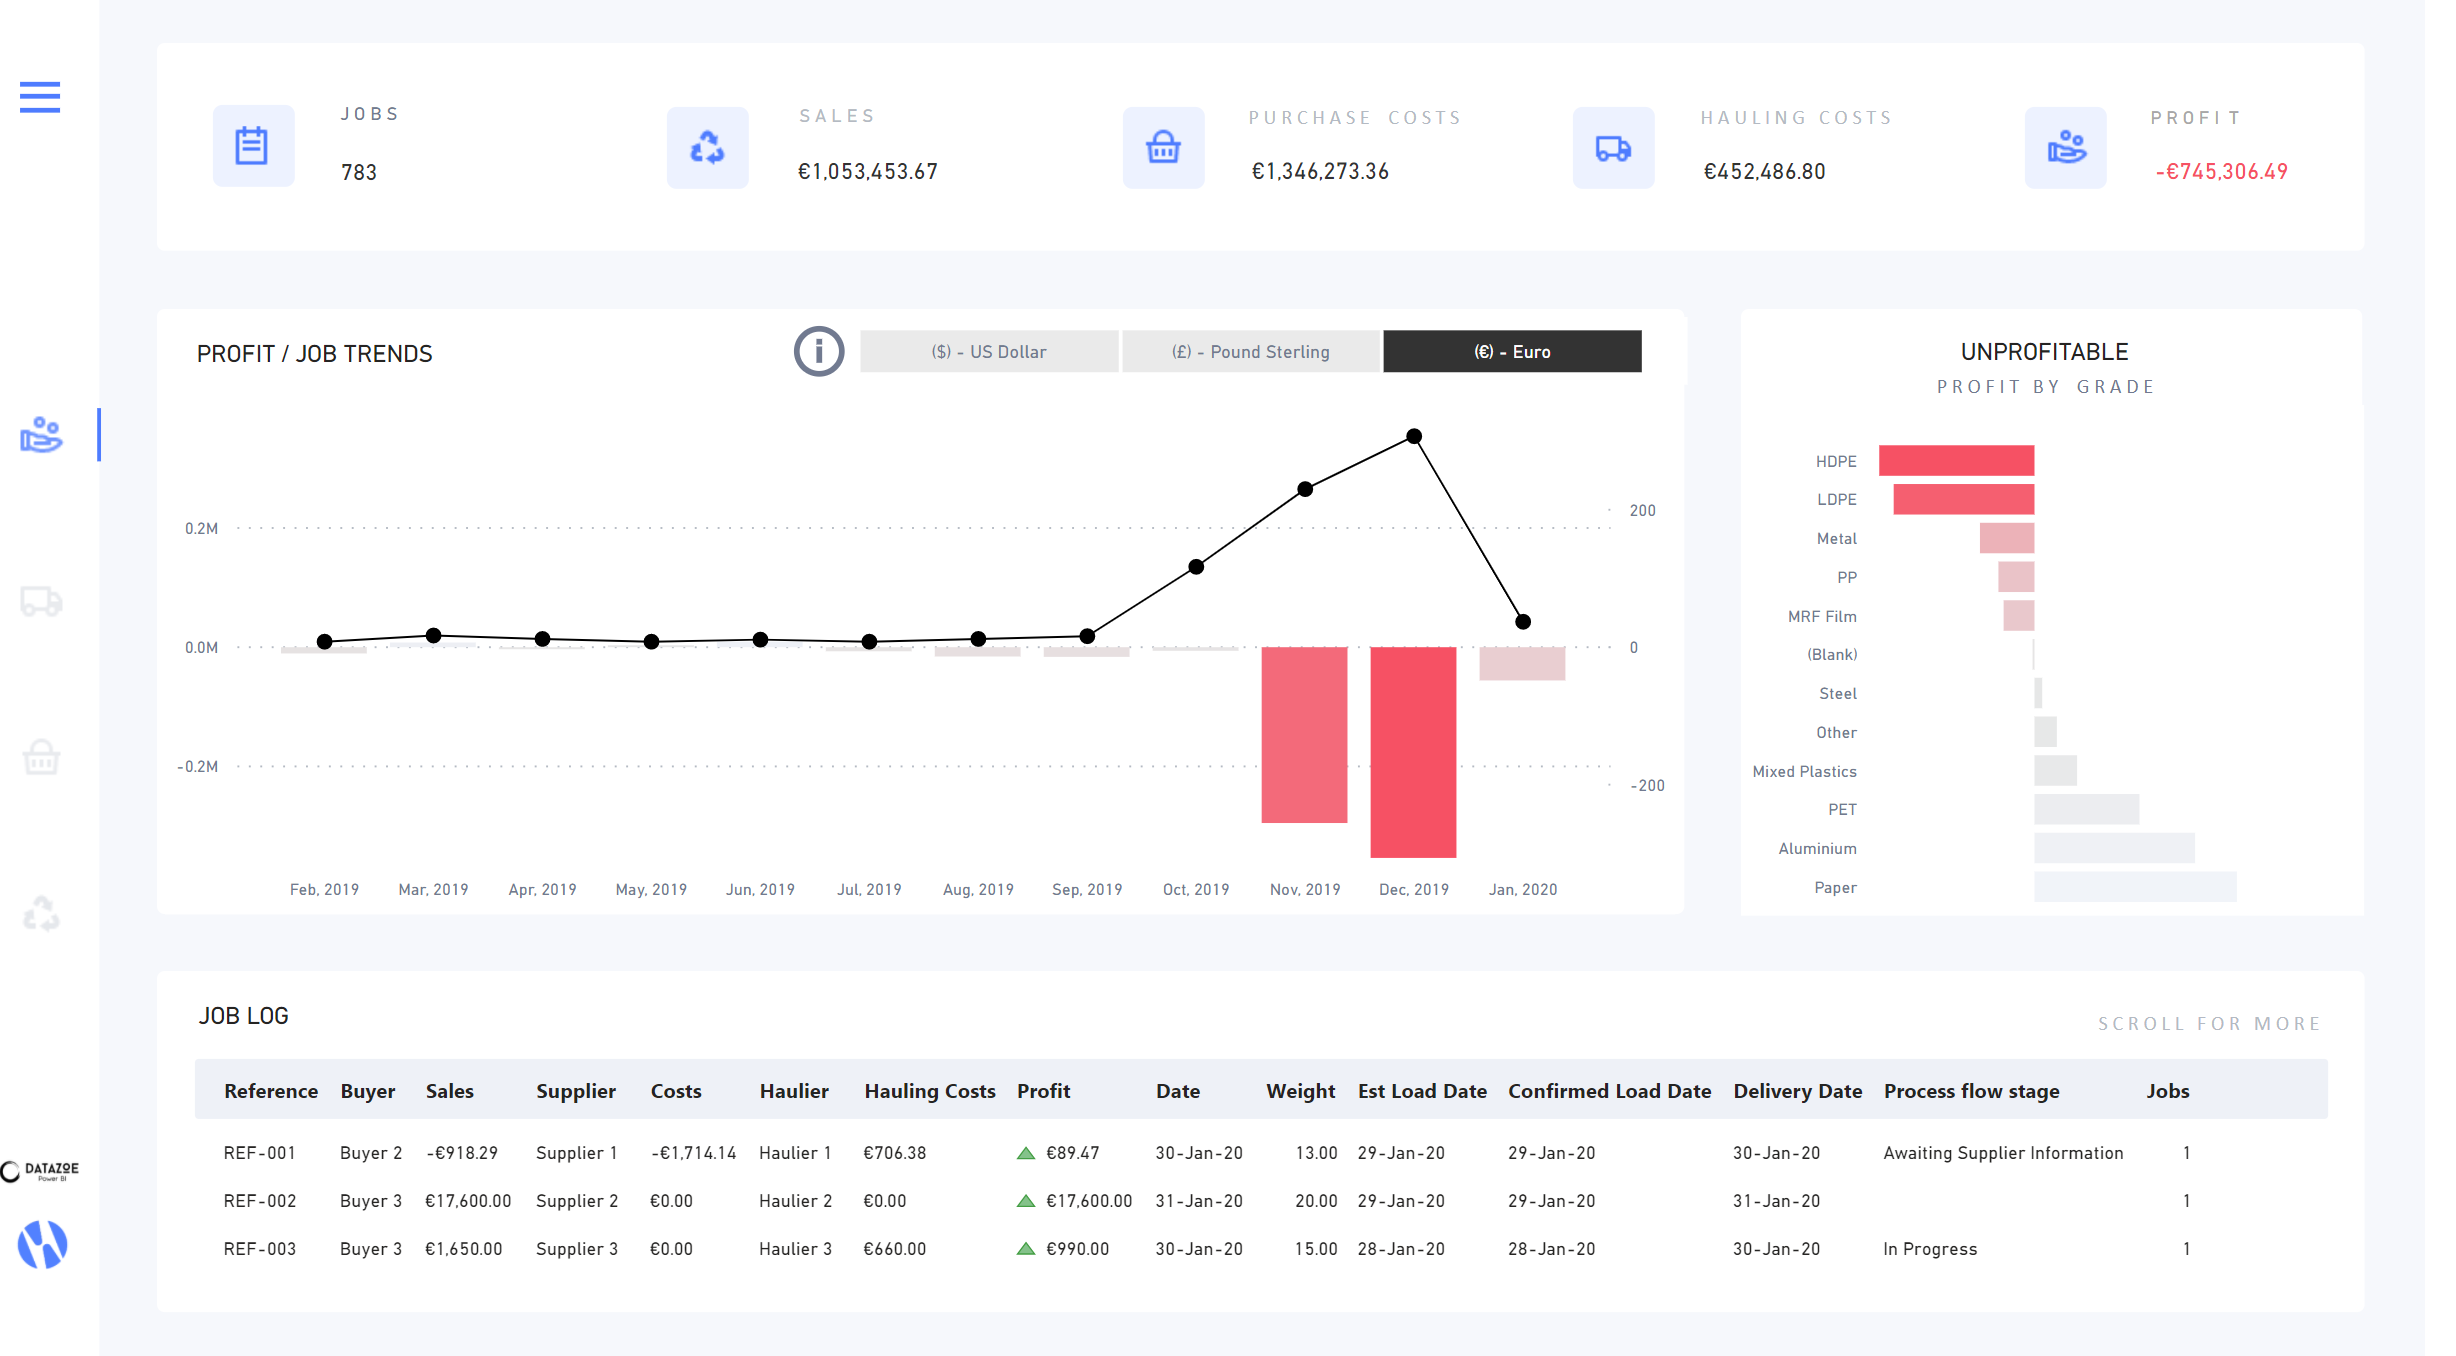
Profitability, and specifically unprofitability, was what I wanted to highlight. I colored unprofitability in red and then for profitable I chose to fade it out toward the background color. The icons I did keep blue, but otherwise, I stuck to the black/grey/white colors to give highest visibility to the unprofitable. Trying to utilize the design principle of contrast.
I also kept that unprofitable coloring even when I switched topics on the other pages. That way the user would know, ok we had great sales in this grade and yet it was still unprofitable, and they could look at the details in that context.
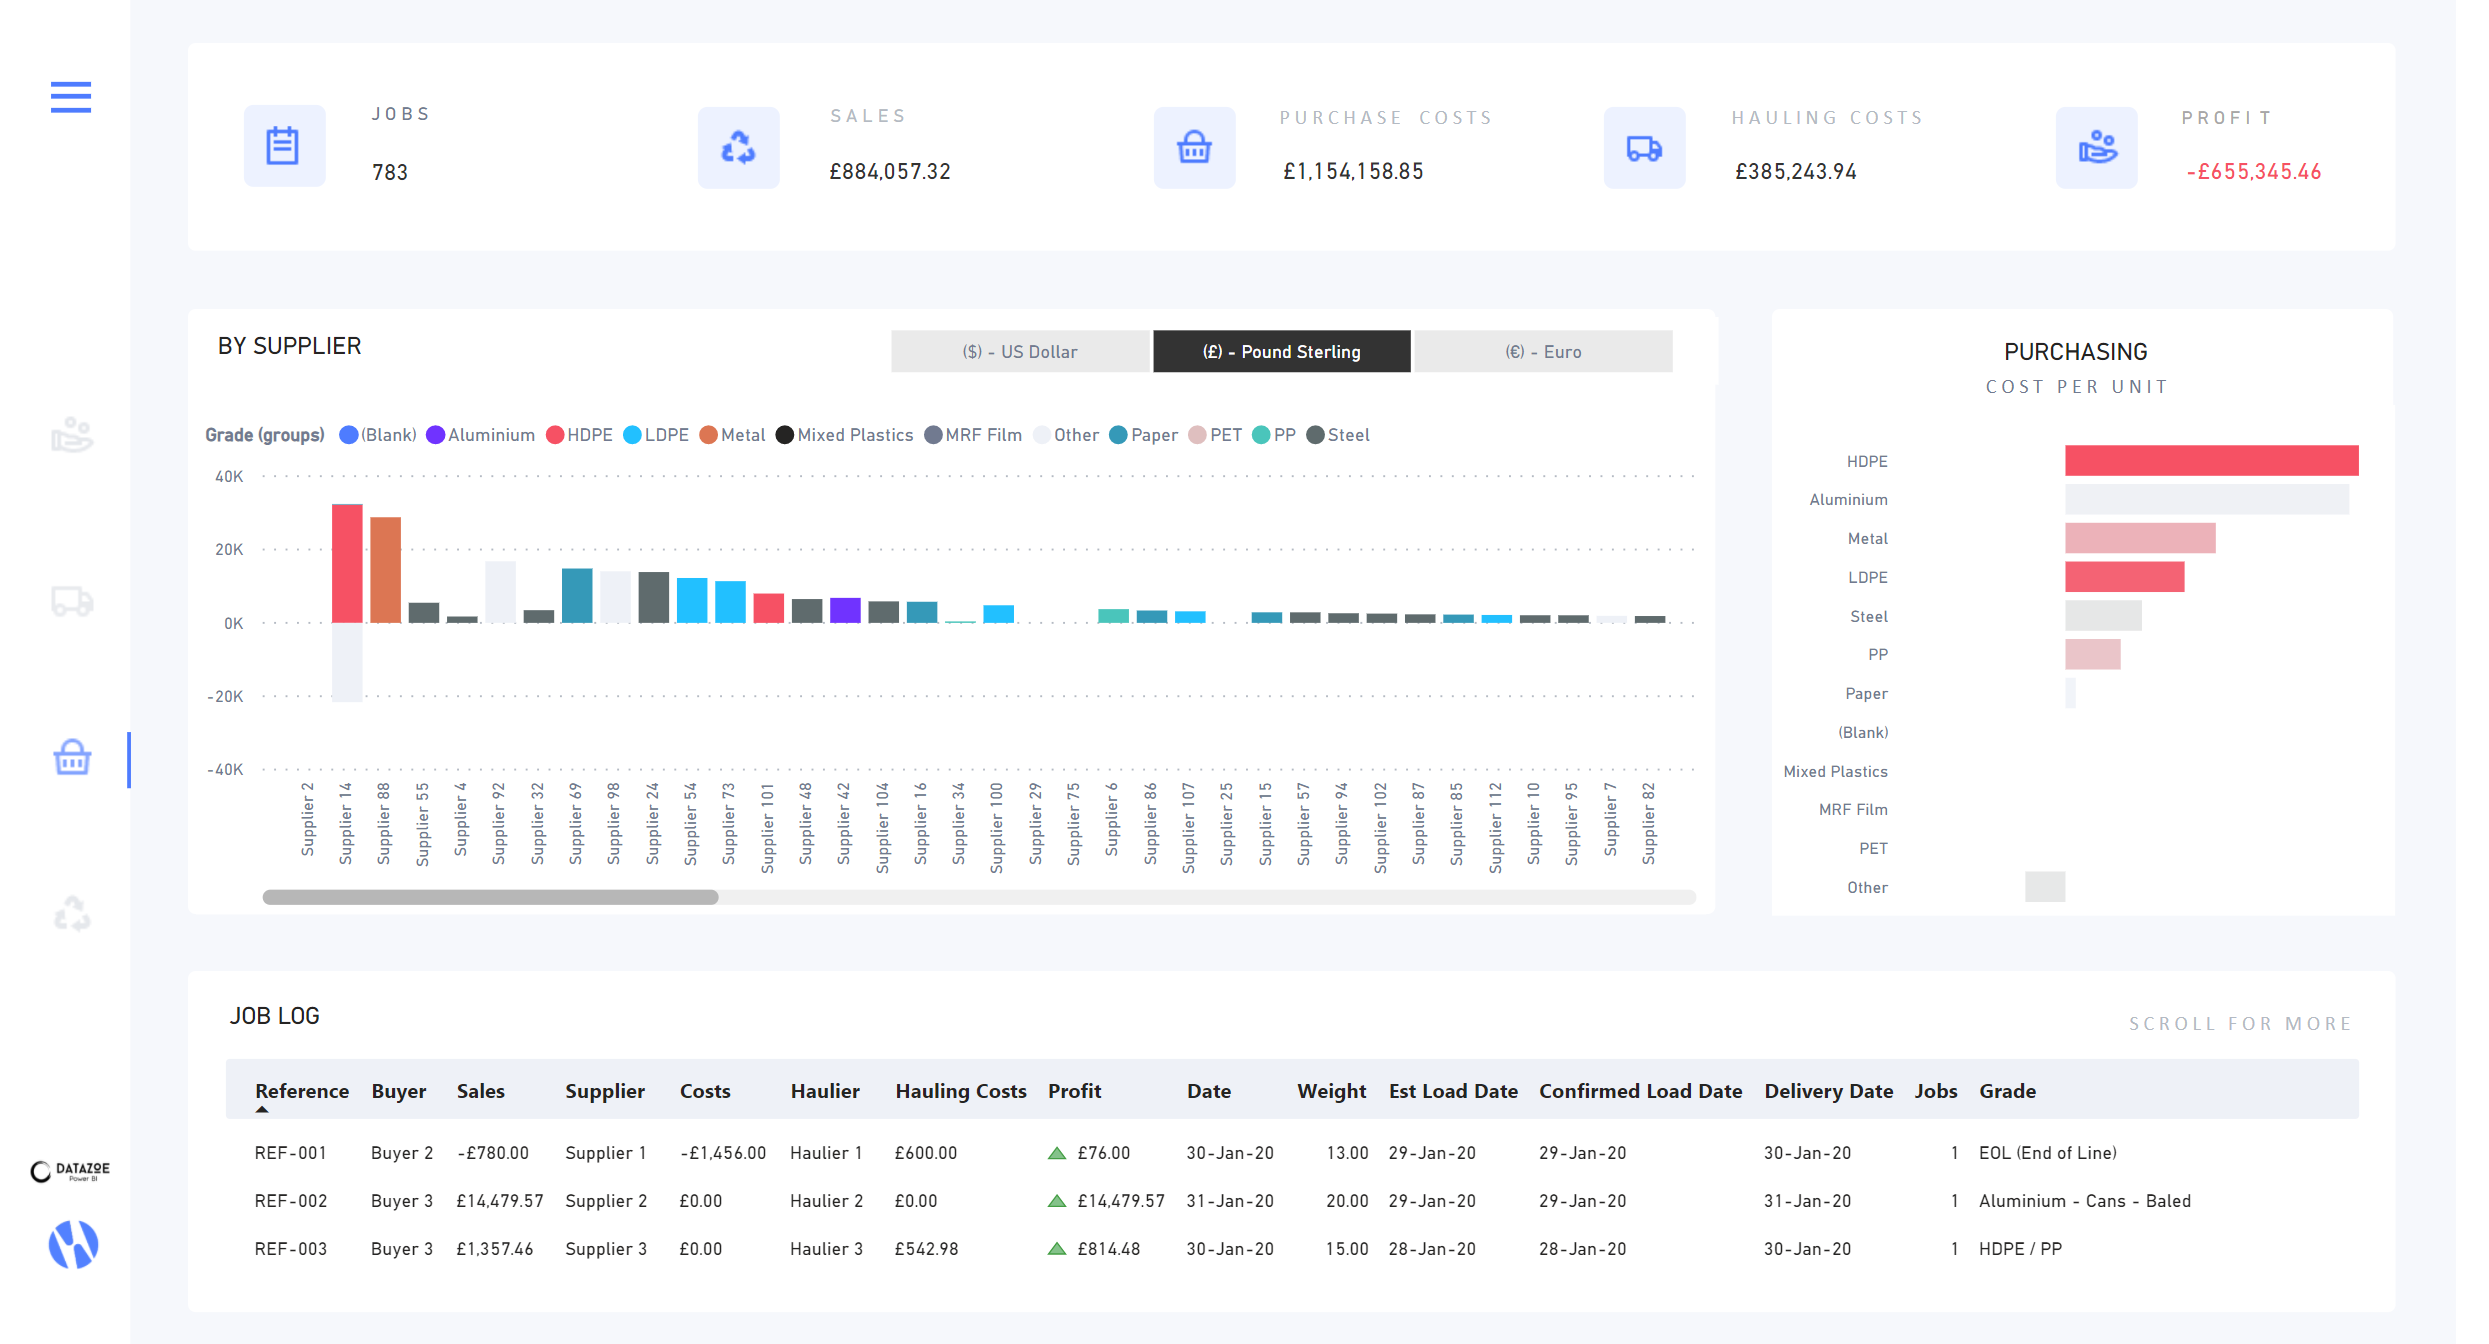
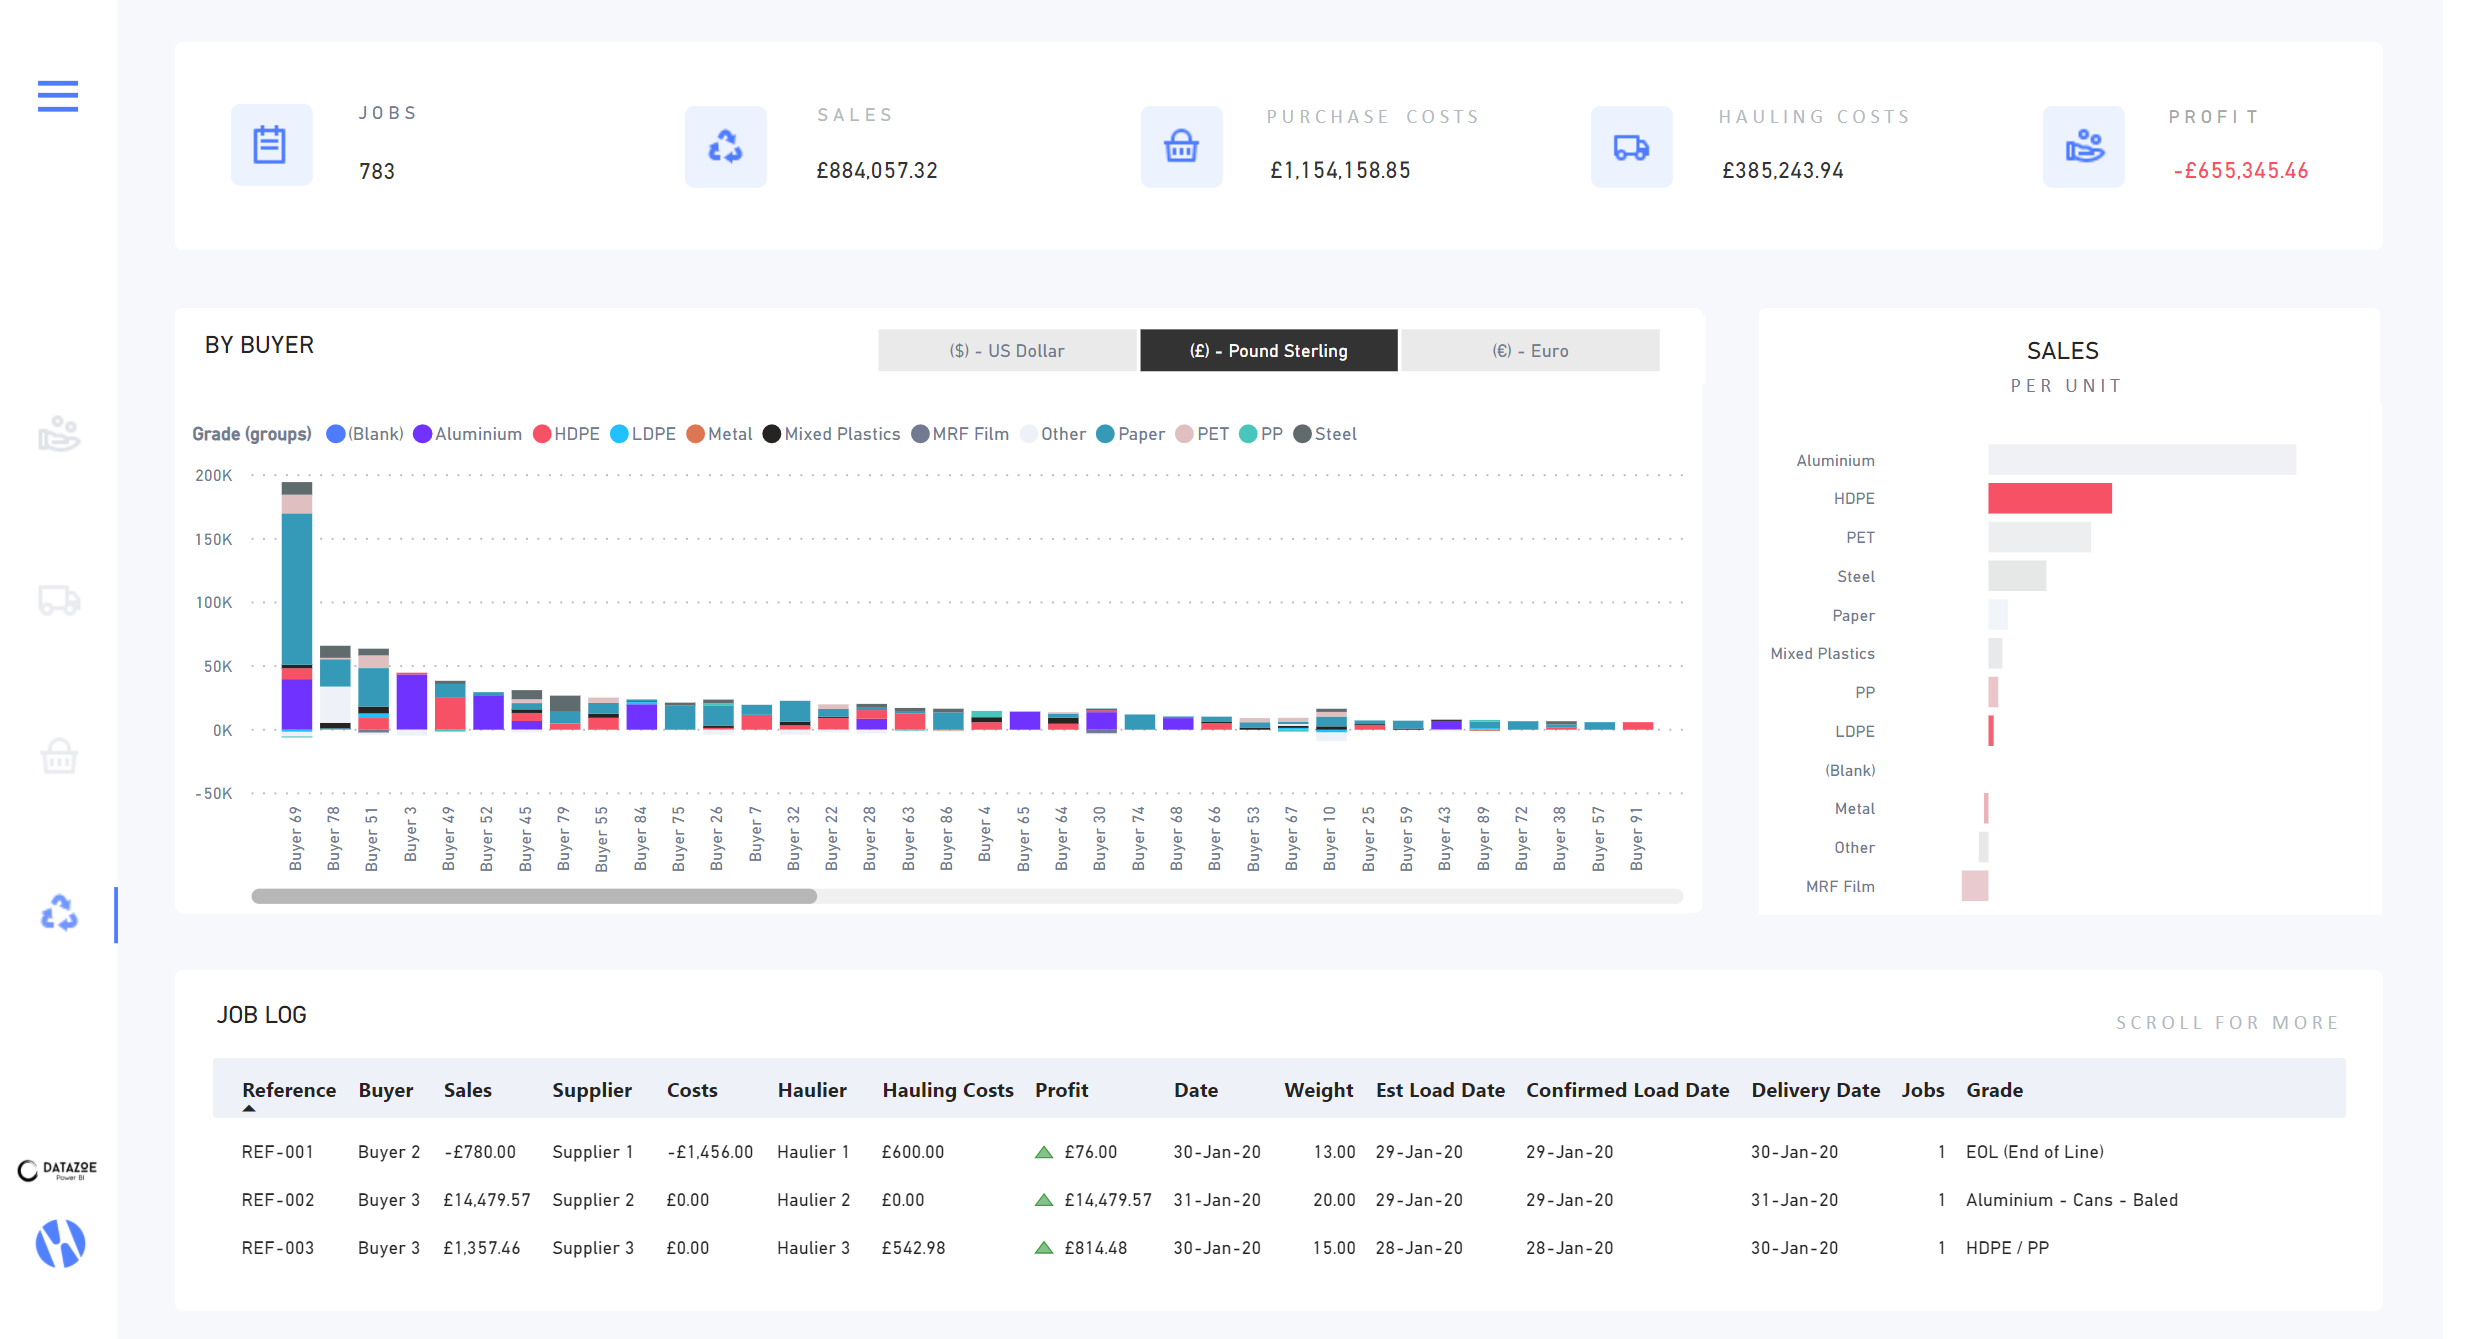
I did get more colorful by the 3rd and 4th tab as I wanted to try and show Buyer/Supplier by grouped grades, by flipping the charts but I am not sure I liked it. The tooltips also have more color, with a specific color for profit, sales, hauling costs, and purchase costs tooltips. I wanted to a way to visually represent that the topic had changed.
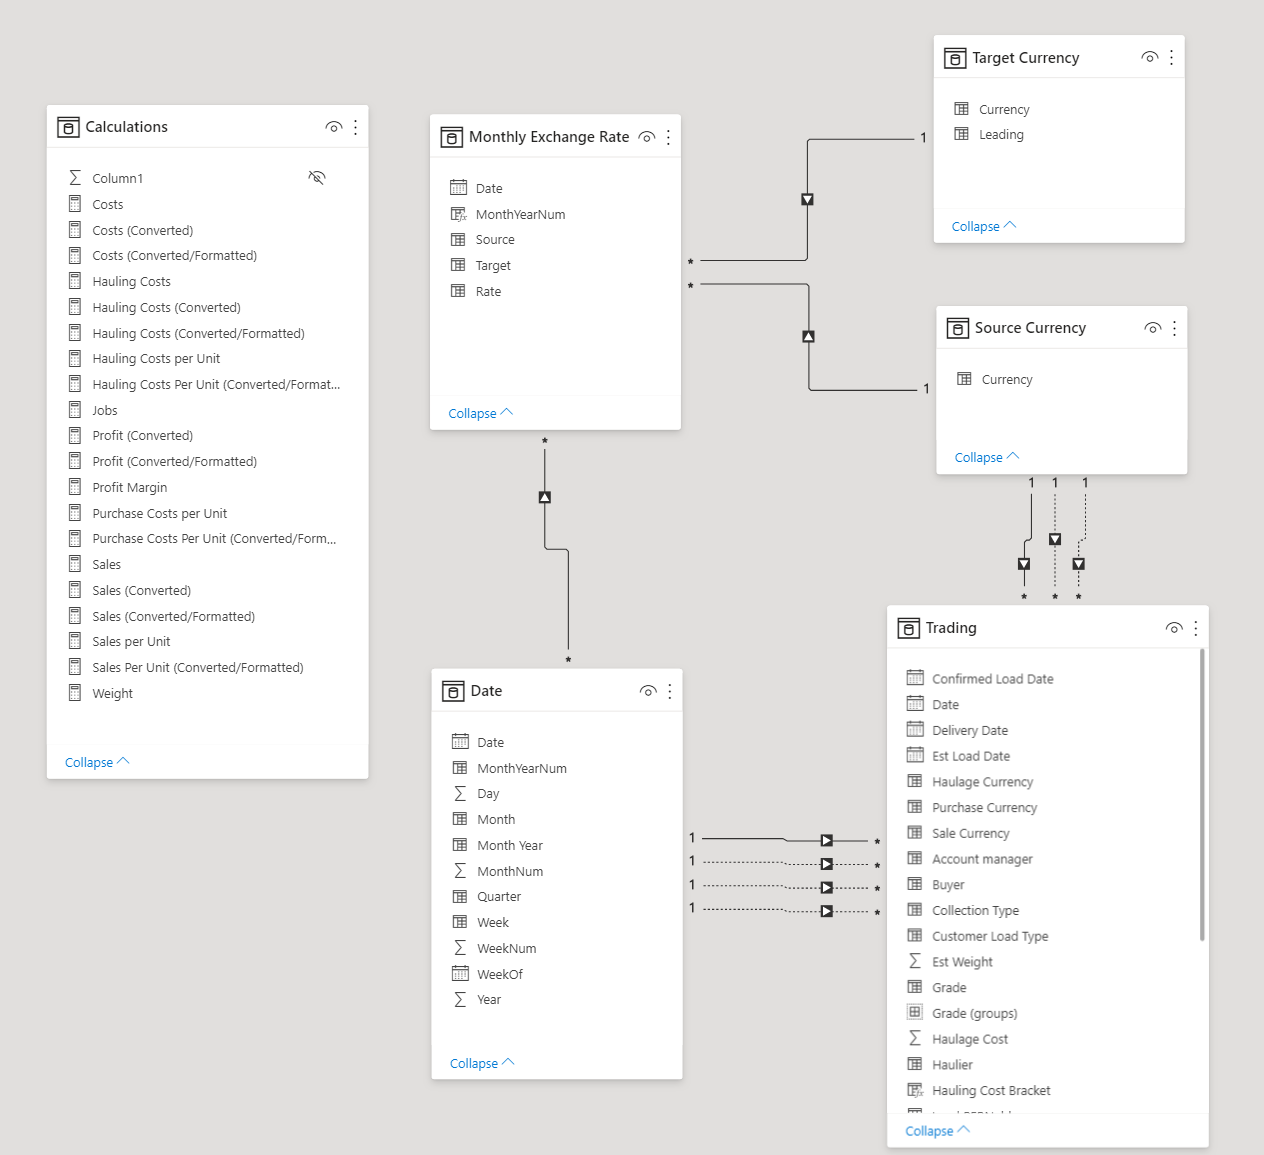
For the currency conversion I utilized https://www.daxpatterns.com/currency-conversion/#. I am sure the content here is fantastic but I do not like watching long videos so I prefer the instructions written out in an article. Finding currencies was annoying but I did find it by month for each of the three currencies then provided the conversion between them. I modified the measures to handle the same source/target currency and took out the error handling (because I preferred to see where it worked and where it didn’t to troubleshoot).
Sales (Converted) =
IF (
    HASONEVALUE ( 'Target Currency'[Currency] ),
    VAR AggregatedSalesInCurrency =
        ADDCOLUMNS (
            SUMMARIZE (
                Trading,
                'Date'[Month Year],
                -- Month granularity
                'Source Currency'[Currency]
            ),
            "@SalesAmount", [Sales],
            "@Rate",
                SWITCH (
                    TRUE (),
                    SELECTEDVALUE ( 'Target Currency'[Currency] ) = 'Source Currency'[Currency], 1,
                    CALCULATE ( SELECTEDVALUE ( 'Monthly Exchange Rate'[Rate] ) )
                )
        )
    VAR Result =
        SUMX (
            AggregatedSalesInCurrency,
            IF ( NOT ( ISBLANK ( [@Rate] ) ), [@SalesAmount] * [@Rate], BLANK () )
        )
    RETURN
        Result + 0
)
I kept this as it was so I could use it in charts, then added another one that formatted it:
Sales (Converted/Formatted) =
VAR _leading =
    SELECTEDVALUE ( 'Target Currency'[Leading] )
VAR _format =
    CONCATENATE ( _leading, "#,##0.00" )
VAR _return =
    IF (
        ISBLANK ( [Sales (Converted)] ),
        BLANK (),
        FORMAT ( [Sales (Converted)], _format )
    )
RETURN
    _return
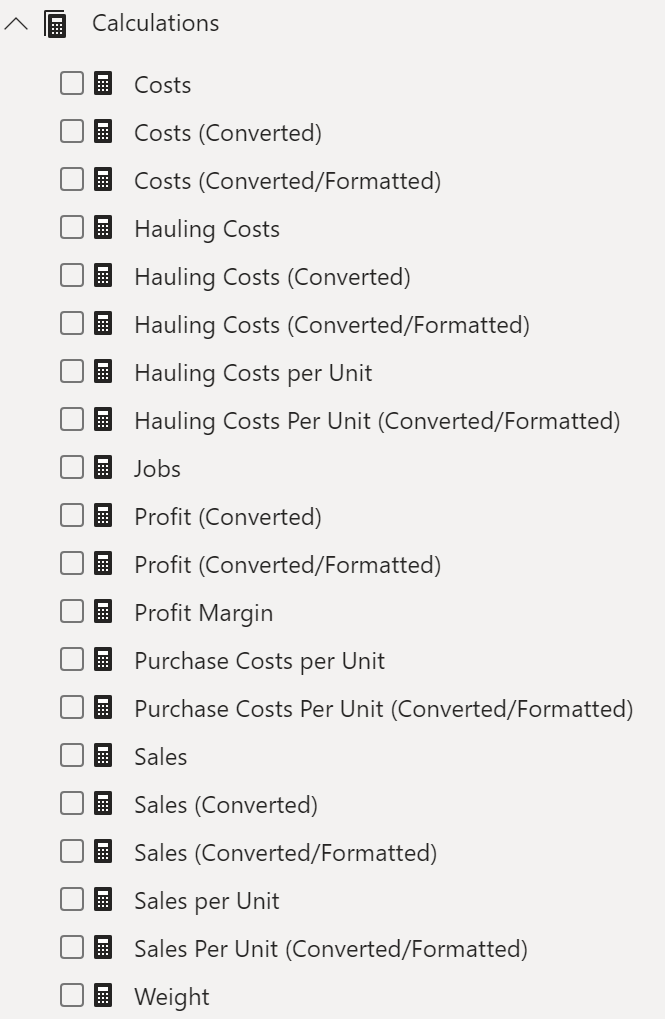
The annoying part was I had to do this with every measure. I probably could have looked into calculation groups.
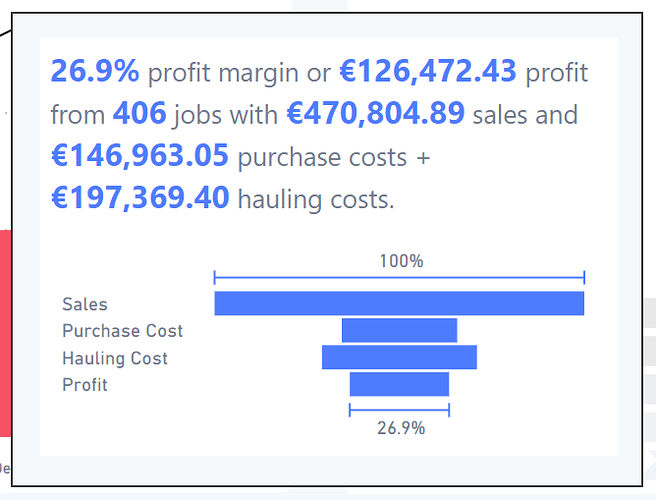
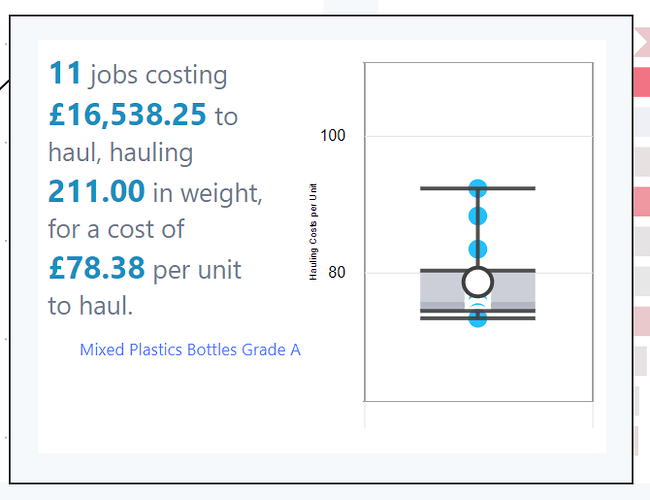
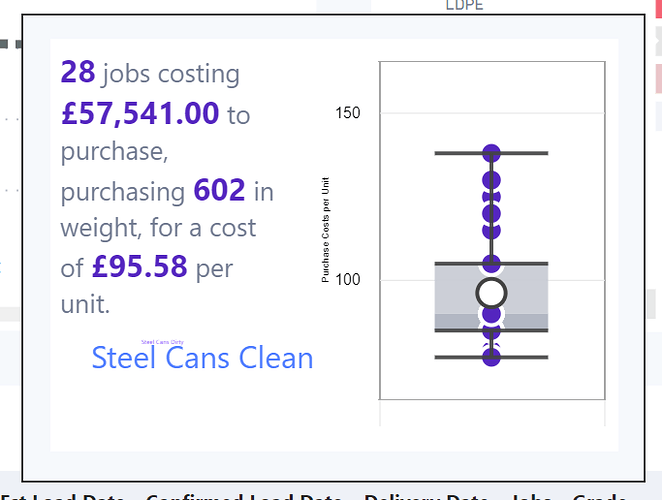
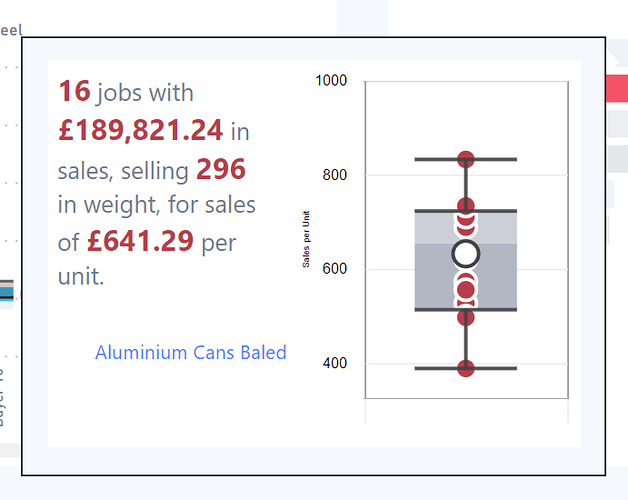
As the formatting was more text than number, I still had to use the converted number only on charts. This meant the tooltips also included the non-formatted version by default. To get around this I included a tooltip to show formatted values for all the values used in the charts. This allowed for some more insight to how the number was derived, for profit, and the range of numbers found, in the case of a cost or sale per grade or supplier/buyer. I had originally tried to use a scatterplot but it would not work nicely small, so I fell back to my favorite box whisker. I also used the enlighten data story. While the new narration visual could also have been used, I find it super annoying to modify.
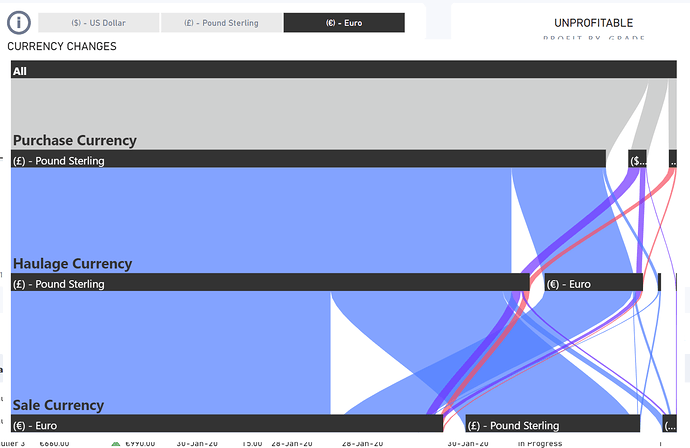
I also wanted to do some looking a the change in currency, as while we did not get geo data, it can be inferred from the currency conversions. For this I utilized the Sankey chart, which gives a great view of the currency flow.
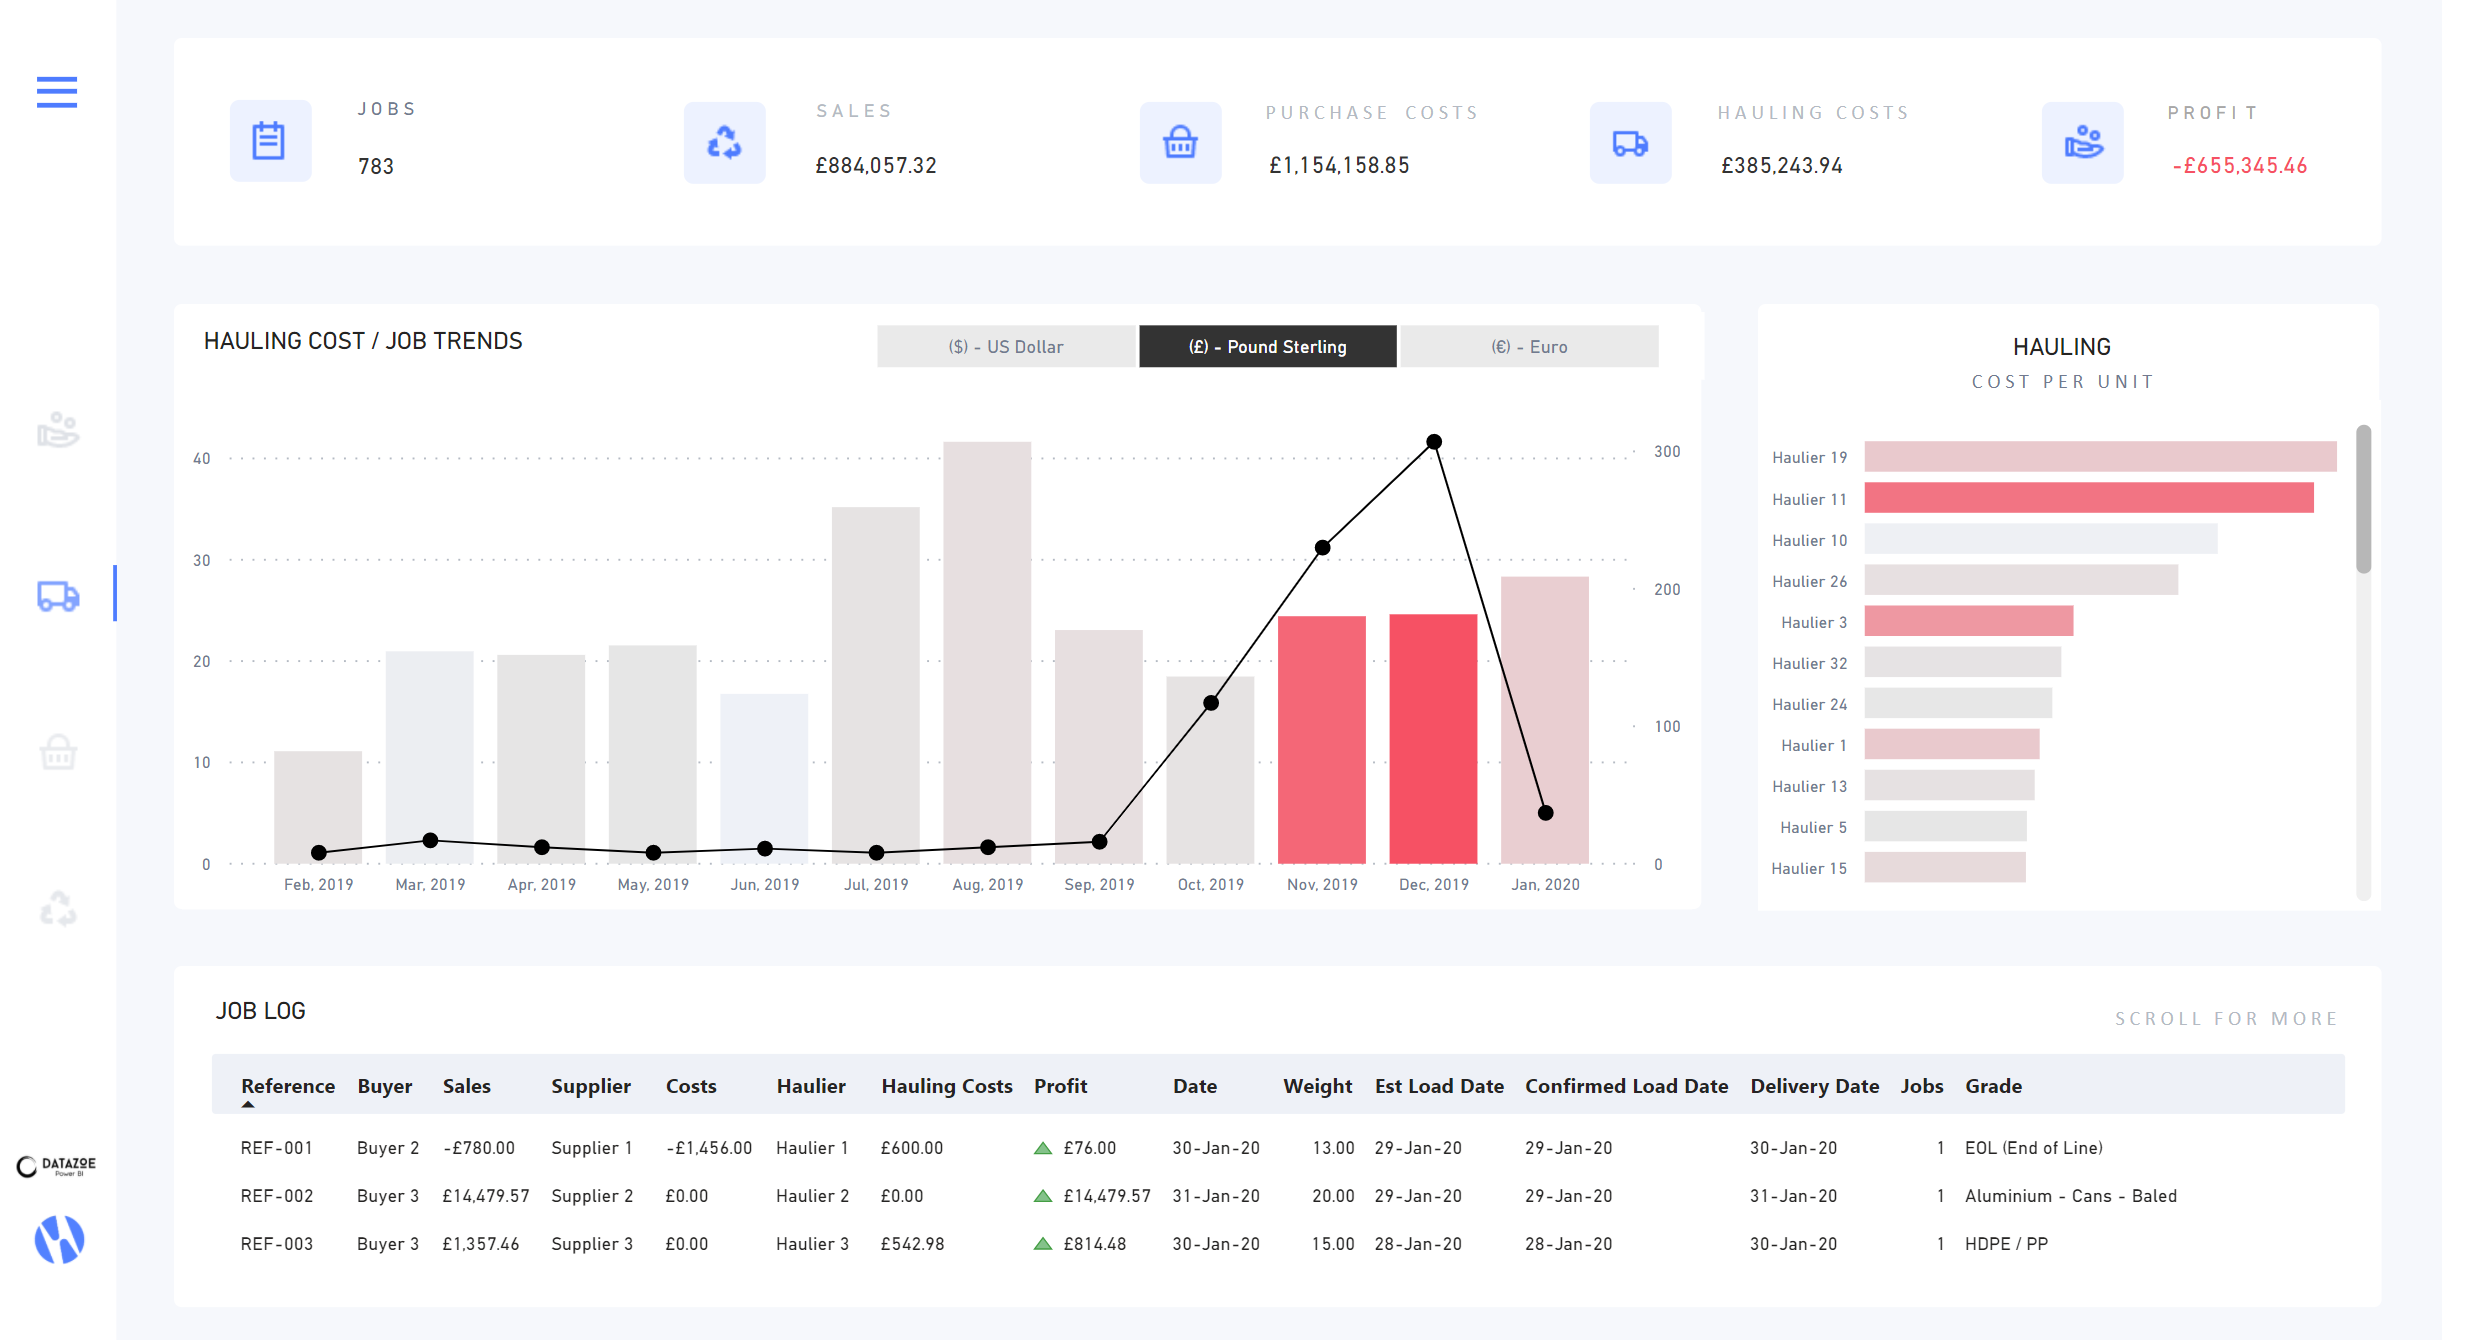
For analysis, I chose the measure per unit in a way to try and normalize the data and allow comparison of haulers, suppliers, and buyers. And even to compare these measures over time in a way that accounts for the huge uptick in jobs in November and December.
Finally, I used the free numerro template for the design base. This way I could share the PBIX as it’s not using premium paid content. I did modify the technique a little on the sidebar (to use buttons with image fill instead of images), but not the look and functionality.
I didn’t get to sorting out all the fonts and syncing of the slicers, and also I thought I should probably make the tooltips accessible through drill through too.
Overall this took me a couple days to do. I had the idea of what I wanted to do, but the biggest chunks of time went to getting the currency conversion to work, then followed by messing around with all the tooltips and functionality of the report.